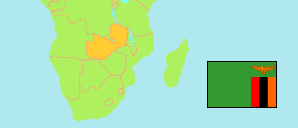
Mbala
District in Zambia
Contents: Subdivision
The population in Mbala as well as related information and services (Wikipedia, Google, images).
| Name | Status | Population Census 2010-10-16 | |
|---|---|---|---|
| Mbala | District | 203,129 | |
| Chela | Ward | 16,338 | → |
| Chimbili | Ward | 12,476 | → |
| Chinyika | Ward | 9,478 | → |
| Chozi | Ward | 7,131 | → |
| Intala | Ward | 23,064 | → |
| Ipembe | Ward | 6,577 | → |
| Kawimbe | Ward | 8,768 | → |
| Kazimolwa | Ward | 24,077 | → |
| Lapisha | Ward | 12,379 | → |
| Luandi | Ward | 22,432 | → |
| Malamba | Ward | 7,918 | → |
| Motomoto | Ward | 3,057 | → |
| Mukololo | Ward | 13,129 | → |
| Mwamba | Ward | 6,098 | → |
| Mwambezi | Ward | 8,118 | → |
| Mwiluzi | Ward | 6,965 | → |
| Nsunzu | Ward | 15,124 | → |
| Zambia | Republic | 13,092,666 |
Source: Central Statistical Office Zambia (web).
Explanation: Districts in the boundaries of 2016 and wards in the the boundaries of 2010; slight deviations from the actual situation are possible. Area figures are computed by using geospatial data.
Further information about the population structure:
| Gender (C 2010) | |
|---|---|
| Males | 100,703 |
| Females | 102,426 |
| Age Groups (C 2010) | |
|---|---|
| 0-14 years | 100,165 |
| 15-64 years | 97,510 |
| 65+ years | 5,454 |
| Age Distribution (C 2010) | |
|---|---|
| 0-9 years | 71,650 |
| 10-19 years | 51,700 |
| 20-29 years | 31,735 |
| 30-39 years | 20,197 |
| 40-49 years | 12,589 |
| 50-59 years | 7,262 |
| 60+ years | 7,996 |
| Urbanization (C 2010) | |
|---|---|
| Rural | 179,119 |
| Urban | 24,010 |
