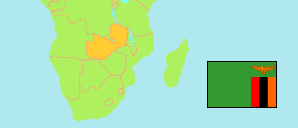
Luwingu
District in Zambia
Contents: Subdivision
The population in Luwingu as well as related information and services (Wikipedia, Google, images).
| Name | Status | Population Census 2010-10-16 | |
|---|---|---|---|
| Luwingu | District | 122,136 | |
| Bwalinde | Ward | 9,987 | → |
| Chifwile | Ward | 4,642 | → |
| Chulungoma | Ward | 6,720 | → |
| Ibale | Ward | 2,643 | → |
| Ilambo | Ward | 4,212 | → |
| Ipusukilo | Ward | 4,015 | → |
| Isangano | Ward | 7,337 | → |
| Isansa | Ward | 5,328 | → |
| Kaela | Ward | 5,836 | → |
| Kafinsa | Ward | 3,480 | → |
| Kampemba | Ward | 6,755 | → |
| Katilye | Ward | 4,026 | → |
| Katopola | Ward | 10,766 | → |
| Lwata | Ward | 5,170 | → |
| Masonde | Ward | 6,594 | → |
| Mufili | Ward | 4,859 | → |
| Mulalashi | Ward | 2,652 | → |
| Munshishinga | Ward | 5,650 | → |
| Mushitu-Wamboo | Ward | 6,377 | → |
| Mwelawamangu | Ward | 8,828 | → |
| Namukolo | Ward | 1,158 | → |
| Ntandashi | Ward | 5,101 | → |
| Zambia | Republic | 13,092,666 |
Source: Central Statistical Office Zambia (web).
Explanation: Districts in the boundaries of 2016 and wards in the the boundaries of 2010; slight deviations from the actual situation are possible. Area figures are computed by using geospatial data.
Further information about the population structure:
| Gender (C 2010) | |
|---|---|
| Males | 60,294 |
| Females | 61,842 |
| Age Groups (C 2010) | |
|---|---|
| 0-14 years | 59,217 |
| 15-64 years | 59,053 |
| 65+ years | 3,866 |
| Age Distribution (C 2010) | |
|---|---|
| 0-9 years | 42,185 |
| 10-19 years | 30,324 |
| 20-29 years | 19,032 |
| 30-39 years | 12,329 |
| 40-49 years | 8,167 |
| 50-59 years | 4,496 |
| 60+ years | 5,603 |
| Urbanization (C 2010) | |
|---|---|
| Rural | 111,370 |
| Urban | 10,766 |