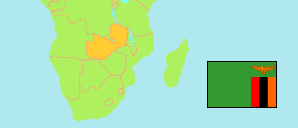
Chilubi
District in Zambia
Contents: Subdivision
The population in Chilubi as well as related information and services (Wikipedia, Google, images).
| Name | Status | Population Census 2010-10-16 | |
|---|---|---|---|
| Chilubi | District | 81,248 | |
| Bulilo | Ward | 6,489 | → |
| Bumba | Ward | 5,923 | → |
| Chifwenge | Ward | 8,130 | → |
| Chiloba | Ward | 4,355 | → |
| Chinkundu | Ward | 1,612 | → |
| Chisupa | Ward | 3,664 | → |
| Kambashi | Ward | 3,081 | → |
| Kanama | Ward | 1,458 | → |
| Kanchindi | Ward | 7,192 | → |
| Kapoka | Ward | 2,304 | → |
| Kashitu | Ward | 2,659 | → |
| Katamba | Ward | 3,227 | → |
| Kawena | Ward | 5,699 | → |
| Luangwa | Ward | 2,118 | → |
| Lwenda | Ward | 3,729 | → |
| Mofu | Ward | 2,994 | → |
| Mpanshya | Ward | 1,636 | → |
| Mubemba | Ward | 1,972 | → |
| Mulanda | Ward | 5,497 | → |
| Muteka | Ward | 2,998 | → |
| Ndela | Ward | 3,303 | → |
| Nguni | Ward | 1,208 | → |
| Zambia | Republic | 13,092,666 |
Source: Central Statistical Office Zambia (web).
Explanation: Districts in the boundaries of 2016 and wards in the the boundaries of 2010; slight deviations from the actual situation are possible. Area figures are computed by using geospatial data.
Further information about the population structure:
| Gender (C 2010) | |
|---|---|
| Males | 39,792 |
| Females | 41,456 |
| Age Groups (C 2010) | |
|---|---|
| 0-14 years | 40,198 |
| 15-64 years | 38,672 |
| 65+ years | 2,378 |
| Age Distribution (C 2010) | |
|---|---|
| 0-9 years | 29,565 |
| 10-19 years | 19,000 |
| 20-29 years | 11,715 |
| 30-39 years | 8,652 |
| 40-49 years | 5,669 |
| 50-59 years | 3,098 |
| 60+ years | 3,549 |
| Urbanization (C 2010) | |
|---|---|
| Rural | 76,953 |
| Urban | 4,295 |
