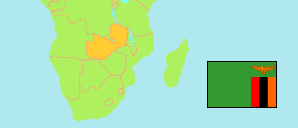
Mpika
District in Zambia
Contents: Subdivision
The population in Mpika as well as related information and services (Wikipedia, Google, images).
| Name | Status | Population Census 2010-10-16 | |
|---|---|---|---|
| Mpika | District | 203,379 | |
| Chambeshi | Ward | 6,237 | → |
| Chibwa | Ward | 6,057 | → |
| Chifungwe | Ward | 5,860 | → |
| Chikanda | Ward | 8,221 | → |
| Chinama | Ward | 5,800 | → |
| Chipembele | Ward | 8,769 | → |
| Chishibe Isonde | Ward | 15,430 | → |
| Lubaleshi | Ward | 12,344 | → |
| Lubambala | Ward | 16,191 | → |
| Lukulu | Ward | 8,420 | → |
| Lulimala | Ward | 10,447 | → |
| Lulingila | Ward | 10,223 | → |
| Lwitikila | Ward | 10,400 | → |
| Mansha | Ward | 6,410 | → |
| Muchinga | Ward | 4,445 | → |
| Mukungwa | Ward | 7,884 | → |
| Mumbubu | Ward | 8,424 | → |
| Munikashi | Ward | 7,789 | → |
| Mupamadzi | Ward | 8,285 | → |
| Musakanya | Ward | 22,631 | → |
| Mutekwe | Ward | 5,097 | → |
| Nachikufu | Ward | 8,015 | → |
| Zambia | Republic | 13,092,666 |
Source: Central Statistical Office Zambia (web).
Explanation: Districts in the boundaries of 2016 and wards in the the boundaries of 2010; slight deviations from the actual situation are possible. Area figures are computed by using geospatial data.
Further information about the population structure:
| Gender (C 2010) | |
|---|---|
| Males | 100,267 |
| Females | 103,112 |
| Age Groups (C 2010) | |
|---|---|
| 0-14 years | 97,726 |
| 15-64 years | 99,592 |
| 65+ years | 6,061 |
| Age Distribution (C 2010) | |
|---|---|
| 0-9 years | 69,126 |
| 10-19 years | 51,520 |
| 20-29 years | 32,040 |
| 30-39 years | 21,360 |
| 40-49 years | 12,856 |
| 50-59 years | 7,507 |
| 60+ years | 8,970 |
| Urbanization (C 2010) | |
|---|---|
| Rural | 163,655 |
| Urban | 39,724 |
