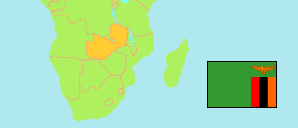
Luangwa
District in Zambia
Contents: Subdivision
The population in Luangwa as well as related information and services (Wikipedia, Google, images).
| Name | Status | Population Census 2010-10-16 | |
|---|---|---|---|
| Luangwa | District | 24,304 | |
| Chikoma | Ward | 2,245 | → |
| Chiriwe | Ward | 301 | → |
| Dzalo | Ward | 5,100 | → |
| Kabowo | Ward | 204 | → |
| Kapoche | Ward | 1,468 | → |
| Katondwe | Ward | 2,514 | → |
| Kaunga | Ward | 2,795 | → |
| Lunya | Ward | 626 | → |
| Mandombe | Ward | 730 | → |
| Mankhokwe | Ward | 670 | → |
| Mburuma | Ward | 2,878 | → |
| M'kaliva | Ward | 868 | → |
| Mphuka | Ward | 1,165 | → |
| Mwalilia | Ward | 1,820 | → |
| Phwazi | Ward | 920 | → |
| Zambia | Republic | 13,092,666 |
Source: Central Statistical Office Zambia (web).
Explanation: Districts in the boundaries of 2016 and wards in the the boundaries of 2010; slight deviations from the actual situation are possible. Area figures are computed by using geospatial data.
Further information about the population structure:
| Gender (C 2010) | |
|---|---|
| Males | 11,979 |
| Females | 12,325 |
| Age Groups (C 2010) | |
|---|---|
| 0-14 years | 11,371 |
| 15-64 years | 12,134 |
| 65+ years | 799 |
| Age Distribution (C 2010) | |
|---|---|
| 0-9 years | 7,724 |
| 10-19 years | 6,702 |
| 20-29 years | 3,623 |
| 30-39 years | 2,729 |
| 40-49 years | 1,553 |
| 50-59 years | 863 |
| 60+ years | 1,110 |
| Urbanization (C 2010) | |
|---|---|
| Rural | 19,507 |
| Urban | 4,797 |