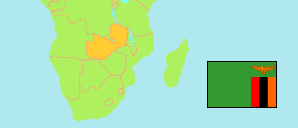
Samfya
District in Zambia
Contents: Subdivision
The population in Samfya as well as related information and services (Wikipedia, Google, images).
| Name | Status | Population Census 2010-10-16 | |
|---|---|---|---|
| Samfya | District | 174,906 | |
| Chifunabuli | Ward | 16,082 | → |
| Chimana | Ward | 19,907 | → |
| Chinkutila | Ward | 10,067 | → |
| Chishi | Ward | 5,354 | → |
| Isamba | Ward | 8,723 | → |
| Kafumbo | Ward | 7,651 | → |
| Kapamba | Ward | 5,217 | → |
| Kapata | Ward | 16,294 | → |
| Kapilibila | Ward | 3,661 | → |
| Kasaba | Ward | 11,397 | → |
| Kasansa | Ward | 6,884 | → |
| Kasongele | Ward | 6,585 | → |
| Katanshya | Ward | 10,119 | → |
| Lumamya | Ward | 5,669 | → |
| Mano | Ward | 17,781 | → |
| Masonde | Ward | 8,921 | → |
| Mbabala | Ward | 5,179 | → |
| Musaba | Ward | 9,415 | → |
| Zambia | Republic | 13,092,666 |
Source: Central Statistical Office Zambia (web).
Explanation: Districts in the boundaries of 2016 and wards in the the boundaries of 2010; slight deviations from the actual situation are possible. Area figures are computed by using geospatial data.
Further information about the population structure:
| Gender (C 2010) | |
|---|---|
| Males | 85,697 |
| Females | 89,209 |
| Age Groups (C 2010) | |
|---|---|
| 0-14 years | 85,092 |
| 15-64 years | 84,230 |
| 65+ years | 5,584 |
| Age Distribution (C 2010) | |
|---|---|
| 0-9 years | 61,087 |
| 10-19 years | 42,687 |
| 20-29 years | 25,093 |
| 30-39 years | 18,603 |
| 40-49 years | 12,073 |
| 50-59 years | 6,971 |
| 60+ years | 8,392 |
| Urbanization (C 2010) | |
|---|---|
| Rural | 154,999 |
| Urban | 19,907 |