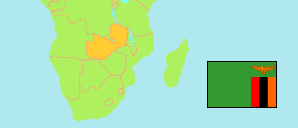
Mansa
District in Zambia
Contents: Subdivision
The population in Mansa as well as related information and services (Wikipedia, Google, images).
| Name | Status | Population Census 2010-10-16 | |
|---|---|---|---|
| Mansa | District | 204,998 | |
| Chansusu | Ward | 9,695 | → |
| Chibeleka | Ward | 8,191 | → |
| Chilyapa | Ward | 6,034 | → |
| Kaole | Ward | 3,079 | → |
| Lukangaba | Ward | 17,988 | → |
| Lwingishi | Ward | 16,532 | → |
| Mansa | Ward | 29,039 | → |
| Misakalala | Ward | 10,473 | → |
| Muchinka | Ward | 32,985 | → |
| Mulelenshi | Ward | 21,533 | → |
| Muleshi | Ward | 7,527 | → |
| Mushipashi | Ward | 8,392 | → |
| Mutuna | Ward | 13,998 | → |
| Myulu | Ward | 19,532 | → |
| Zambia | Republic | 13,092,666 |
Source: Central Statistical Office Zambia (web).
Explanation: Districts in the boundaries of 2016 and wards in the the boundaries of 2010; slight deviations from the actual situation are possible. Area figures are computed by using geospatial data.
Further information about the population structure:
| Gender (C 2010) | |
|---|---|
| Males | 100,873 |
| Females | 104,125 |
| Age Groups (C 2010) | |
|---|---|
| 0-14 years | 95,785 |
| 15-64 years | 103,706 |
| 65+ years | 5,507 |
| Age Distribution (C 2010) | |
|---|---|
| 0-9 years | 67,314 |
| 10-19 years | 52,429 |
| 20-29 years | 33,016 |
| 30-39 years | 21,863 |
| 40-49 years | 13,402 |
| 50-59 years | 8,347 |
| 60+ years | 8,627 |
| Urbanization (C 2010) | |
|---|---|
| Rural | 126,845 |
| Urban | 78,153 |