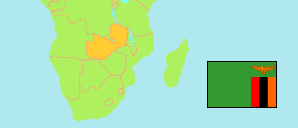
Lundazi
District in Zambia
Contents: Subdivision
The population in Lundazi as well as related information and services (Wikipedia, Google, images).
| Name | Status | Population Census 2010-10-16 | |
|---|---|---|---|
| Lundazi | District | 323,870 | |
| Chaboli | Ward | 8,522 | → |
| Chamtowa | Ward | 12,923 | → |
| Chibande | Ward | 9,385 | → |
| Chilola | Ward | 10,195 | → |
| Chimaliro | Ward | 10,180 | → |
| Diwa | Ward | 23,410 | → |
| Kachama | Ward | 9,119 | → |
| Kajilime | Ward | 18,363 | → |
| Kamimba | Ward | 11,306 | → |
| Kapilisanga | Ward | 10,169 | → |
| Kazembe | Ward | 8,780 | → |
| Lukusuzi | Ward | 2,155 | → |
| Lumimba | Ward | 8,679 | → |
| Lunevwa | Ward | 15,966 | → |
| Luwerezi | Ward | 4,961 | → |
| Magodi | Ward | 17,762 | → |
| Manda Hill | Ward | 4,371 | → |
| Membe | Ward | 5,044 | → |
| Mkomba | Ward | 5,097 | → |
| Mnyamazi | Ward | 34,442 | → |
| Msuzi | Ward | 16,622 | → |
| Ndonda | Ward | 9,606 | → |
| Nkhanga | Ward | 20,060 | → |
| Nthintimila | Ward | 8,241 | → |
| Susa | Ward | 10,576 | → |
| Vuu | Ward | 19,976 | → |
| Wachitangachi | Ward | 7,960 | → |
| Zambia | Republic | 13,092,666 |
Source: Central Statistical Office Zambia (web).
Explanation: Districts in the boundaries of 2016 and wards in the the boundaries of 2010; slight deviations from the actual situation are possible. Area figures are computed by using geospatial data.
Further information about the population structure:
| Gender (C 2010) | |
|---|---|
| Males | 158,379 |
| Females | 165,491 |
| Age Groups (C 2010) | |
|---|---|
| 0-14 years | 156,077 |
| 15-64 years | 157,511 |
| 65+ years | 10,282 |
| Age Distribution (C 2010) | |
|---|---|
| 0-9 years | 111,090 |
| 10-19 years | 80,282 |
| 20-29 years | 50,203 |
| 30-39 years | 33,707 |
| 40-49 years | 21,050 |
| 50-59 years | 12,408 |
| 60+ years | 15,130 |
| Urbanization (C 2010) | |
|---|---|
| Rural | 307,968 |
| Urban | 15,902 |