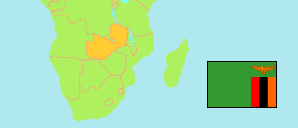
Chipata
District in Zambia
Contents: Subdivision
The population in Chipata as well as related information and services (Wikipedia, Google, images).
| Name | Status | Population Census 2010-10-16 | |
|---|---|---|---|
| Chipata | District | 455,783 | |
| Chikando | Ward | 25,424 | → |
| Chingazi | Ward | 15,149 | → |
| Chipangali | Ward | 20,558 | → |
| Chiparamba | Ward | 11,511 | → |
| Dilika | Ward | 23,324 | → |
| Kanjala | Ward | 35,577 | → |
| Kapata | Ward | 33,969 | → |
| Kasenga | Ward | 14,350 | → |
| Kazimule | Ward | 11,476 | → |
| Khova | Ward | 10,590 | → |
| Kwenje | Ward | 29,330 | → |
| Makangila | Ward | 7,559 | → |
| Makungwa | Ward | 12,901 | → |
| Mboza | Ward | 11,792 | → |
| Mkowe | Ward | 2,009 | → |
| Msandile | Ward | 16,423 | → |
| Msanga | Ward | 66,455 | → |
| Ng'ongwe | Ward | 15,425 | → |
| Nsingo | Ward | 20,376 | → |
| Nthope | Ward | 32,993 | → |
| Rukuzye | Ward | 19,936 | → |
| Sisinje | Ward | 18,656 | → |
| Zambia | Republic | 13,092,666 |
Source: Central Statistical Office Zambia (web).
Explanation: Districts in the boundaries of 2016 and wards in the the boundaries of 2010; slight deviations from the actual situation are possible. Area figures are computed by using geospatial data.
Further information about the population structure:
| Gender (C 2010) | |
|---|---|
| Males | 224,934 |
| Females | 230,849 |
| Age Groups (C 2010) | |
|---|---|
| 0-14 years | 209,305 |
| 15-64 years | 231,714 |
| 65+ years | 14,764 |
| Age Distribution (C 2010) | |
|---|---|
| 0-9 years | 146,064 |
| 10-19 years | 116,029 |
| 20-29 years | 76,145 |
| 30-39 years | 51,293 |
| 40-49 years | 28,632 |
| 50-59 years | 16,537 |
| 60+ years | 21,083 |
| Urbanization (C 2010) | |
|---|---|
| Rural | 339,156 |
| Urban | 116,627 |