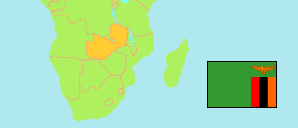
Masaiti
District in Zambia
Contents: Subdivision
The population in Masaiti as well as related information and services (Wikipedia, Google, images).
| Name | Status | Population Census 2010-10-16 | |
|---|---|---|---|
| Masaiti | District | 103,857 | |
| Chilulu | Ward | 3,318 | → |
| Chinondo | Ward | 3,373 | → |
| Chondwe | Ward | 9,346 | → |
| Ishitwe | Ward | 4,733 | → |
| Kashitu | Ward | 7,520 | → |
| Katonte | Ward | 823 | → |
| Katuba | Ward | 5,674 | → |
| Luansobe | Ward | 5,543 | → |
| Lumano | Ward | 8,580 | → |
| Majaliwa | Ward | 6,892 | → |
| Masangano | Ward | 9,073 | → |
| Miengwe | Ward | 8,730 | → |
| Miputu | Ward | 4,505 | → |
| Mishikishi | Ward | 6,099 | → |
| Mutaba | Ward | 6,797 | → |
| Mwatishi | Ward | 5,748 | → |
| Shimibanga | Ward | 7,103 | → |
| Zambia | Republic | 13,092,666 |
Source: Central Statistical Office Zambia (web).
Explanation: Districts in the boundaries of 2016 and wards in the the boundaries of 2010; slight deviations from the actual situation are possible. Area figures are computed by using geospatial data.