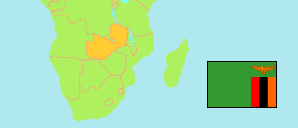
Kabwe
District in Zambia
Contents: Subdivision
The population in Kabwe as well as related information and services (Wikipedia, Google, images).
| Name | Status | Population Census 2010-10-16 | |
|---|---|---|---|
| Kabwe | District | 202,360 | |
| Ben Kapufi | Ward | 4,998 | → |
| Bwacha | Ward | 9,565 | → |
| Chililalila | Ward | 5,489 | → |
| Chimanimani | Ward | 4,787 | → |
| Chinyanja | Ward | 3,261 | → |
| Chirwa | Ward | 26,987 | → |
| David Ramushu | Ward | 8,148 | → |
| Highridge | Ward | 7,195 | → |
| Justine Kabwe | Ward | 5,376 | → |
| Kalonga | Ward | 10,680 | → |
| Kang'omba | Ward | 4,856 | → |
| Kaputula | Ward | 13,084 | → |
| Kawama | Ward | 10,234 | → |
| Luangwa | Ward | 16,005 | → |
| Luansase | Ward | 3,004 | → |
| Makululu | Ward | 3,828 | → |
| Moomba | Ward | 11,038 | → |
| Mpima | Ward | 6,588 | → |
| Munga | Ward | 3,397 | → |
| Munyama | Ward | 2,248 | → |
| Muwowo | Ward | 1,792 | → |
| Muwowo East | Ward | 4,223 | → |
| Nakoli | Ward | 9,895 | → |
| Ngungu | Ward | 5,775 | → |
| Njanji | Ward | 6,076 | → |
| Waya | Ward | 5,601 | → |
| Zambezi | Ward | 8,230 | → |
| Zambia | Republic | 13,092,666 |
Source: Central Statistical Office Zambia (web).
Explanation: Districts in the boundaries of 2016 and wards in the the boundaries of 2010; slight deviations from the actual situation are possible. Area figures are computed by using geospatial data.
Further information about the population structure:
| Gender (C 2010) | |
|---|---|
| Males | 98,781 |
| Females | 103,579 |
| Age Groups (C 2010) | |
|---|---|
| 0-14 years | 80,706 |
| 15-64 years | 117,084 |
| 65+ years | 4,570 |
| Age Distribution (C 2010) | |
|---|---|
| 0-9 years | 53,266 |
| 10-19 years | 55,971 |
| 20-29 years | 37,617 |
| 30-39 years | 25,123 |
| 40-49 years | 14,469 |
| 50-59 years | 8,712 |
| 60+ years | 7,202 |
| Urbanization (C 2010) | |
|---|---|
| Urban | 202,360 |