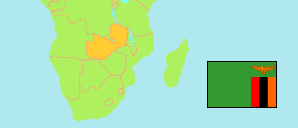
Chilanga
District in Zambia
Contents: Population
The population development of Chilanga as well as related information and services (Wikipedia, Google, images).
| Name | Status | Population Census 2000-10-20 | Population Census 2010-10-16 | Population Census 2022-08-18 | |
|---|---|---|---|---|---|
| Chilanga | District | 56,673 | 107,051 | 225,276 | |
| Zambia | Republic | 9,885,591 | 13,092,666 | 19,610,769 |
Source: Central Statistical Office Zambia (web).
Explanation: Provinces and districts in 2022 boundaries. The results of the 2022 census are preliminary; its reference period is 18 August to 7 September.
Further information about the population structure:
| Gender (C 2022) | |
|---|---|
| Males | 111,095 |
| Females | 114,181 |