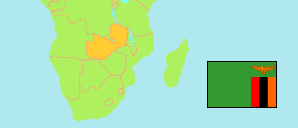
Luapula
Province in Zambia
Contents: Subdivision
The population development in Luapula as well as related information and services (Wikipedia, Google, images).
| Name | Status | Population Census 2000-10-20 | Population Census 2010-10-16 | Population Census 2022-08-18 | |
|---|---|---|---|---|---|
| Luapula | Province | 775,353 | 991,927 | 1,519,478 | |
| Chembe | District | 29,110 | 23,394 | 51,634 | → |
| Chienge (Chiengi) | District | 83,824 | 114,225 | 190,566 | → |
| Chifunabuli (← Samfya) | District | ... | 83,337 | 116,634 | → |
| Chipili | District | 27,389 | 32,565 | 47,473 | → |
| Kawambwa | District | 66,957 | 89,120 | 124,046 | → |
| Lunga | District | 19,078 | 24,005 | 39,462 | → |
| Mansa | District | 150,639 | 204,998 | 329,622 | → |
| Milenge | District | 28,790 | 43,337 | 56,638 | → |
| Mwansabombwe | District | 35,546 | 45,294 | 58,992 | → |
| Mwense | District | 78,370 | 87,276 | 122,796 | → |
| Nchelenge | District | 111,119 | 152,807 | 234,259 | → |
| Samfya | District | ... | 91,569 | 147,356 | → |
| Zambia | Republic | 9,885,591 | 13,092,666 | 19,693,423 |
Source: Central Statistical Office Zambia.
Explanation: Provinces and districts in 2022 boundaries. The reference period of the 2022 census is 18 August to 7 September.