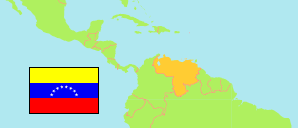
Venezuela: Vargas
Contents: Parishes
The population of the parishes of the State and Municipality of Vargas according to latest official estimates and projections.
| Name | Status | Population Estimate 2001-06-30 | Population Estimate 2011-06-30 | Population Projection 2019-06-30 | |
|---|---|---|---|---|---|
| Caraballeda | Parish | 43,194 | 47,679 | 51,102 | → |
| Carayaca | Parish | 36,931 | 41,003 | 44,168 | → |
| Carlos Soublette | Parish | 27,180 | 30,525 | 33,168 | → |
| Caruao | Parish | 5,662 | 5,897 | 6,021 | → |
| Catia La Mar | Parish | 78,796 | 85,288 | 90,031 | → |
| El Junko | Parish | 3,857 | 4,249 | 4,538 | → |
| La Guaira | Parish | 16,679 | 18,704 | 20,309 | → |
| Macuto | Parish | 17,903 | 19,968 | 21,576 | → |
| Maiquetía | Parish | 31,529 | 34,650 | 37,037 | → |
| Naiguatá | Parish | 15,929 | 17,681 | 19,033 | → |
| Urimare (Raúl Leoni) | Parish | 43,310 | 48,201 | 51,998 | → |
| Vargas | State | 320,970 | 353,845 | 378,981 |
Source: Instituto Nacional de Estadística, Venezuela (web).
Explanation: The population projection does not consider emigration caused by the current economical and political situation in Venezuela.
Further information about the population structure:
| Gender (C 2011) | |
|---|---|
| Males | 173,880 |
| Females | 179,040 |
| Age Groups (C 2011) | |
|---|---|
| 0-14 years | 89,206 |
| 15-64 years | 239,642 |
| 65+ years | 24,072 |
| Age Distribution (C 2011) | |
|---|---|
| 0-9 years | 58,871 |
| 10-19 years | 61,895 |
| 20-29 years | 61,118 |
| 30-39 years | 53,376 |
| 40-49 years | 45,067 |
| 50-59 years | 36,011 |
| 60-69 years | 20,911 |
| 70-79 years | 10,790 |
| 80+ years | 4,881 |
| Urbanization (C 2011) | |
|---|---|
| Rural | 35,920 |
| Urban | 317,000 |
| Ethnic Group (C 2011) | |
|---|---|
| Indigenous | 336 |
| Afro-Venezuelan | 19,696 |
| Mestizos | 168,373 |
| White | 156,402 |
| Other Ethnic Group | 5,462 |
| Literacy (A10+) (C 2011) | |
|---|---|
| yes | 285,614 |
| no | 8,435 |