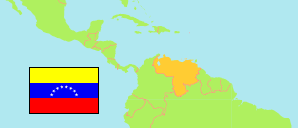
Portuguesa
State in Venezuela
Contents: Subdivision
The population development in Portuguesa as well as related information and services (Wikipedia, Google, images).
| Name | Status | Population Estimate 2001-06-30 | Population Estimate 2011-06-30 | Population Projection 2019-06-30 | |
|---|---|---|---|---|---|
| Portuguesa | State | 776,903 | 929,195 | 1,055,246 | |
| Agua Blanca | Municipality | 18,003 | 21,362 | 24,155 | → |
| Araure | Municipality | 139,047 | 169,473 | 195,109 | → |
| Esteller | Municipality | 38,337 | 45,468 | 51,377 | → |
| Guanare | Municipality | 172,532 | 205,705 | 232,739 | → |
| Guanarito | Municipality | 32,062 | 38,329 | 43,587 | → |
| Monseñor José Vicente de Unda | Municipality | 20,362 | 24,259 | 27,520 | → |
| Ospino | Municipality | 42,915 | 50,457 | 56,619 | → |
| Páez | Municipality | 153,662 | 185,861 | 212,662 | → |
| Papelón | Municipality | 14,563 | 17,178 | 19,334 | → |
| San Genaro de Boconoíto | Municipality | 20,224 | 23,983 | 27,105 | → |
| San Rafael de Onoto | Municipality | 16,270 | 19,137 | 21,489 | → |
| Santa Rosalía | Municipality | 15,217 | 18,012 | 20,330 | → |
| Sucre | Municipality | 35,858 | 42,615 | 48,235 | → |
| Turén | Municipality | 57,851 | 67,356 | 74,985 | → |
| Venezuela | Republic | 24,802,885 | 28,944,070 | 32,219,521 |
Source: Instituto Nacional de Estadística, Venezuela (web).
Explanation: The population projection does not consider emigration caused by the current economical and political situation in Venezuela.
Further information about the population structure:
| Gender (C 2011) | |
|---|---|
| Males | 443,918 |
| Females | 432,578 |
| Age Groups (C 2011) | |
|---|---|
| 0-14 years | 261,947 |
| 15-64 years | 571,133 |
| 65+ years | 43,416 |
| Age Distribution (C 2011) | |
|---|---|
| 0-9 years | 169,918 |
| 10-19 years | 184,744 |
| 20-29 years | 156,546 |
| 30-39 years | 128,494 |
| 40-49 years | 100,753 |
| 50-59 years | 69,662 |
| 60-69 years | 38,676 |
| 70-79 years | 19,129 |
| 80+ years | 8,574 |
| Urbanization (C 2011) | |
|---|---|
| Rural | 204,984 |
| Urban | 671,512 |
| Ethnic Group (C 2011) | |
|---|---|
| Indigenous | 666 |
| Afro-Venezuelan | 30,913 |
| Mestizos | 507,929 |
| White | 322,920 |
| Other Ethnic Group | 9,986 |
| Literacy (A10+) (C 2011) | |
|---|---|
| yes | 651,108 |
| no | 55,470 |