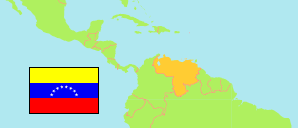
Lara
State in Venezuela
Contents: Subdivision
The population development in Lara as well as related information and services (Wikipedia, Google, images).
| Name | Status | Population Estimate 2001-06-30 | Population Estimate 2011-06-30 | Population Projection 2019-06-30 | |
|---|---|---|---|---|---|
| Lara | State | 1,622,219 | 1,866,725 | 2,047,825 | |
| Andrés Eloy Blanco | Municipality | 41,316 | 48,678 | 54,427 | → |
| Crespo | Municipality | 45,062 | 52,870 | 58,910 | → |
| Iribarren | Municipality | 936,928 | 1,066,193 | 1,159,062 | → |
| Jiménez | Municipality | 87,516 | 103,580 | 116,211 | → |
| Morán | Municipality | 107,699 | 125,667 | 139,385 | → |
| Palavecino | Municipality | 156,336 | 181,821 | 201,094 | → |
| Simón Planas | Municipality | 30,401 | 36,087 | 40,583 | → |
| Torres | Municipality | 162,179 | 188,785 | 208,981 | → |
| Urdaneta | Municipality | 54,782 | 63,044 | 69,172 | → |
| Venezuela | Republic | 24,802,885 | 28,944,070 | 32,219,521 |
Source: Instituto Nacional de Estadística, Venezuela (web).
Explanation: The population projection does not consider emigration caused by the current economical and political situation in Venezuela.
Further information about the population structure:
| Gender (C 2011) | |
|---|---|
| Males | 883,775 |
| Females | 891,092 |
| Age Groups (C 2011) | |
|---|---|
| 0-14 years | 478,217 |
| 15-64 years | 1,187,304 |
| 65+ years | 109,346 |
| Age Distribution (C 2011) | |
|---|---|
| 0-9 years | 311,325 |
| 10-19 years | 337,327 |
| 20-29 years | 314,319 |
| 30-39 years | 270,593 |
| 40-49 years | 217,791 |
| 50-59 years | 160,852 |
| 60-69 years | 90,791 |
| 70-79 years | 47,310 |
| 80+ years | 24,559 |
| Urbanization (C 2011) | |
|---|---|
| Rural | 260,545 |
| Urban | 1,514,322 |
| Ethnic Group (C 2011) | |
|---|---|
| Indigenous | 2,112 |
| Afro-Venezuelan | 40,542 |
| Mestizos | 965,869 |
| White | 738,922 |
| Other Ethnic Group | 17,937 |
| Literacy (A10+) (C 2011) | |
|---|---|
| yes | 1,382,202 |
| no | 81,340 |
