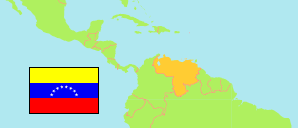
Cojedes
State in Venezuela
Contents: Subdivision
The population development in Cojedes as well as related information and services (Wikipedia, Google, images).
| Name | Status | Population Estimate 2001-06-30 | Population Estimate 2011-06-30 | Population Projection 2019-06-30 | |
|---|---|---|---|---|---|
| Cojedes | State | 264,042 | 324,583 | 370,036 | |
| Anzoátegui | Municipality | 14,838 | 17,133 | 18,587 | → |
| Ezequiel Zamora (San Carlos) | Municipality | 84,983 | 107,168 | 124,460 | → |
| Girardot | Municipality | 10,336 | 11,979 | 13,030 | → |
| Lima Blanco | Municipality | 8,117 | 9,508 | 10,432 | → |
| Pao de San Juan Bautista | Municipality | 14,658 | 16,915 | 18,337 | → |
| Ricaurte | Municipality | 10,966 | 12,731 | 13,873 | → |
| Rómulo Gallegos | Municipality | 15,942 | 18,412 | 19,971 | → |
| Tinaco | Municipality | 26,364 | 32,696 | 37,528 | → |
| Tinaquillo (Falcón) | Municipality | 77,838 | 98,041 | 113,818 | → |
| Venezuela | Republic | 24,802,885 | 28,944,070 | 32,219,521 |
Source: Instituto Nacional de Estadística, Venezuela (web).
Explanation: The population projection does not consider emigration caused by the current economical and political situation in Venezuela.
Further information about the population structure:
| Gender (C 2011) | |
|---|---|
| Males | 163,661 |
| Females | 159,504 |
| Age Groups (C 2011) | |
|---|---|
| 0-14 years | 93,153 |
| 15-64 years | 214,990 |
| 65+ years | 15,022 |
| Age Distribution (C 2011) | |
|---|---|
| 0-9 years | 61,231 |
| 10-19 years | 65,681 |
| 20-29 years | 58,159 |
| 30-39 years | 49,058 |
| 40-49 years | 38,448 |
| 50-59 years | 26,900 |
| 60-69 years | 14,151 |
| 70-79 years | 6,494 |
| 80+ years | 3,043 |
| Urbanization (C 2011) | |
|---|---|
| Rural | 57,624 |
| Urban | 265,541 |
| Ethnic Group (C 2011) | |
|---|---|
| Indigenous | 289 |
| Afro-Venezuelan | 13,588 |
| Mestizos | 190,386 |
| White | 114,588 |
| Other Ethnic Group | 3,142 |
| Literacy (A10+) (C 2011) | |
|---|---|
| yes | 246,623 |
| no | 15,311 |
