Norway
Kingdom of Norway
Kingdom
-

News
On 1 January 2024, Viken county was split in Akershus, Buskerud and Østfold. Also Finnmark and Troms as well as Telemark and Vestfold were re-established as counties and Haram (by a split from Ålesund) as municipality.
2024-03-12
In 2022, 16 settlements were newly listed (4 of them by splits from other settlements). 4 settlements were fused with other settlements and 7 were delisted. Since 2016, Øyer settlement has been split off three times and re-merged three times.
2022-12-27
Granrudmoen-Øyer settlement, which was a merger in 2020, has been split in 2021 into two settlements again. 6 settlements are absorbed by other settlements. Among them are Åros (by Sætre) and Fanahammeren (by Bergen). Largest re-entry is Hell settlement in Stjørdal municipality.
2021-11-10
According to the 2020 definition, 6 settlements are newly listed, 3 former mergers are revoked and 10 settlements are unlisted. In addition, Fetsund-Østersund, Granrudmoen-Øyer and Nodeland-Brennåsen are the result of new mergers and Buskogen was absorbed by Fredrikstad/Sarpsborg.
2020-11-02
The administrative reorganization 2020 has reduced the number of Norwegian counties from 18 to 11 and the number of municipalities from 422 to 356. Further boundary changes result from municipalities that switched the county. Tysfjord and Snillfjord were split between other municipalities.
2020-02-27
According to the 2019 definition of settlements, Konnerud was split from Drammen, Ask from Askøy and Øyer from Granrudmoen. 6 mergers were performed: Oslo with Heggedal, Eidsvoll with Finnbråtan, Søgne with Ausvika, Norheimsund with Øystese, Skei-Surnadalsøra with Glærem and Stjørdalshalsen with Hell.
2019-12-04
-
Major Municipalities
The counties as well as all cities and communes exceeding 20,000 inhabitants.
1986, 1993, 2000, 2006, 2013, 2020, 2026 estimate
-
Administrative Division
The population of the counties and municipalities of Norway.
1986, 1993, 2000, 2006, 2013, 2020, 2026 estimate
2024 boundaries
-
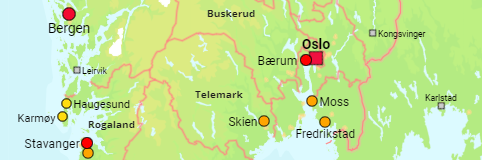
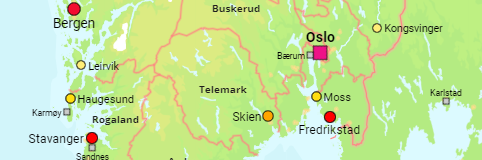
Oslofjord
The population the municipalities and statistical units around the Oslofjord.
2000, 2006, 2013, 2020, 2026 estimate
-
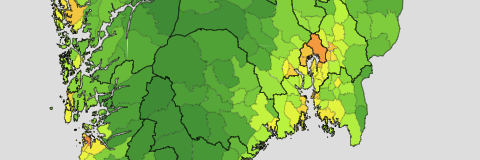
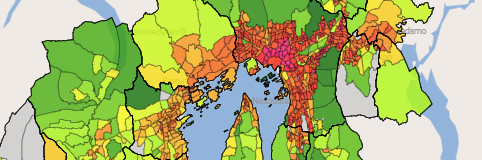
Major Urban Settlements
The counties as well as all urban settlements exceeding 10,000 inhabitants.
2000, 2006, 2013, 2020, 2025 estimate
2024 definition
-
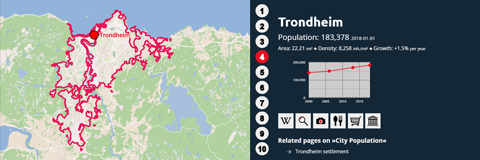
Top 10 Cities
The top 10 settlements of Norway and of the Norwegian counties.
2025 estimate – 2025 definition
-

Counties: Municipalities & Settlements
- Municipalities: the municipalities of the county – 1986, 1993, 2000, 2006, 2013, 2020, 2026 estimate
- Settlements: the municipalities as well as all settlements exceeding 200 inhabitants – 2000, 2006, 2013, 2020, 2025 estimate – 2025 definition
-
Agder
-
Akershus
-
Buskerud
-
Finnmark
-
Innlandet
-
Møre og Romsdal
-
Nordland
-
Østfold
-
Rogaland
-
Telemark
-
Troms
-
Trøndelag
-
Vestfold
-
Vestland
Cities: Boroughs
2006, 2013, 2020, 2026 estimate
 Bergen
 Oslo
Oslo Stavanger