Russia
Russian Federation (territorial extension of January 2014)
Federation
-

News
The south-western municipal districts of Moscow have been reorganized in 2024. Five places (Bugry, Naurskaja, Ojschara, Sernovodskoje, Tel'mana) became cities and three places (Marusino, Mirnyj, Žilino-1) are urban settlements now. Chrebtovaja lost its urban status.
2025-11-17
Two rural places became cities since the 2022 census: Ačchoj-Martan and Koltuši. Dagomys was split from Sochi as urban settlement. Six settlements lost their urban status.
2025-03-06
The results of the 2021 population census show a further decline of population in most rural areas. On the other hand, a significant growth can be observed in suburban areas around large cities.
2022-10-21
In 2020, seven places got the status of an urban settlement: Sirius in Krasnodar Kraj (split from Sochi district) as well as Bobrovo, Butovo, Drožžino, Izmajlovo, Lopatino and Novodrožžino (all in Leninskij urban district in Moscow region). Two distict-level cities (Rošal' and Starodub) were absorbed by their surrounding district.
2021-05-18
In 2019, Murino (in Leningrad oblast) became a city (64,939 inhabitants in 2020 after 7,949 in 2010). Fosforitnyj (in Moskva oblast) was re-established as urban settlement (after a former merger with Chorlovo). 15 settlements lost their urban status and five district mergers were performed.
2020-08-04
Three places gained city status: Kukmor in Tatarstan (2019 population: 17,815), Kurchaloy in Chechnya (pop. 26,115) and Kudrovo in Leningrad Oblast (pop. 31,577). Ryazanovsky in Moskow Oblast (pop. 2,044) regained the status as urban settlement.
2019-08-01
Buryatia Republic (pop. 983,273 in 2019) and Zabaykalsky Krai (pop. 1,065,785 in 2019) moved to from Siberia to Far Eastern Federal District.
2019-07-31
-
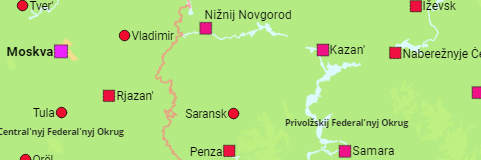
Federal Districts & Major Cities
The Russian federal districts and all cities having more than 100,000 inhabitants.
1979, 1989, 2002, 2010, 2021 census, 2025 estimate
-
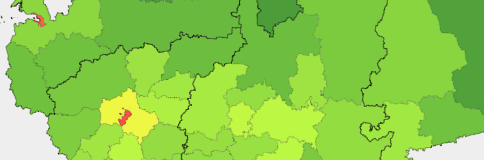
Administrative Division
The population of the federal districts, provinces, territories and republics of Russia.
1979, 1989, 2002, 2010, 2021 census, 2025 estimate
-

Federal Districts
- Major Cities: Federal subjects (oblasts, krais and republics) as well as all all cities, urban settlements and villages exceeding 20,000 inhabitants – 1979, 1989, 2002, 2010, 2021 census, 2025 estimate
- Districts: Federal subjects (oblasts, krais and republics) as well as their districts and district-level cities – 2002, 2010, 2021 census, 2025 estimate
-
Central
-
Far East
-
North West
-
Northern Caucasus
-
Siberia
-
South
-
Ural
-
Volga
Federal Subjects (Oblasts, Krais & Republics)
- Cities: The population all cities and urban settlements – 1989, 2002, 2010, 2021 census, 2025 estimate
- Places: The population all cities and urban settlements as well as of all rural places with at least 3,000 inhabitants – 2002, 2010, 2021 census
- Districts: The population of the districts and district-level cities – 2002, 2010, 2021 census, 2025 estimate
Cities: Municipal Districts
2002, 2010, 2021 census, (2024 estimate)

Crimea
The Ukrainian Autonomous Republic of Crimea and Sevastopol were annexed by Russia in March 2014. This new status is not internationally recognised.