Venezuela
Bolivarische Republik Venezuela
National
-
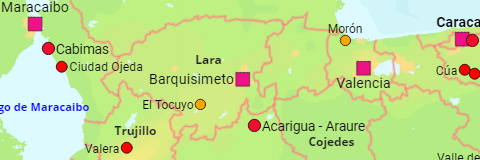
Bundesstaaten und größere Städte
Die Bundesstaaten von Venezuela sowie alle Städte mit mehr als 20.000 Einwohnern.
Zensus 1981, 1990, 2001, 2011, Projektion 2019
-
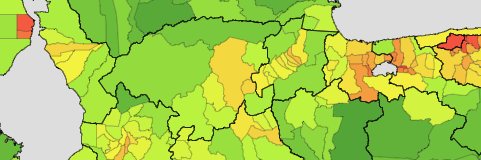
Verwaltungsgliederung
Die Einwohnerzahlen der Bundesstaaten und Gemeinden (Municipios) von Venezuela.
Schätzung 2001, 2011, Projektion 2019
-

Im Gegensatz zu Zensusergebnissen sind die Bevölkerungsprojektionen bezüglich der Untererfassung korrigiert. Sie berücksichtigen aber nicht die Auswanderung durch die aktuelle wirtschaftliche und politische Situation in Venezuela.
-

Bundesstaaten
- Gemeinden: die Gemeinden (Municipios) des Bundesstaats – Schätzung 2001, 2011, Projektion 2019
- Urbane Orte: alle urbanen Orte im Bundesstaat – Zensus 2000, 2011
-
Amazonas
-
Anzoátegui
-
Apure
-
Aragua
-
Barinas
-
Bolívar
-
Carabobo
-
Cojedes
-
Delta Amacuro
-
Dependencias Federales
-
Distrito Capital
-
Falcón
-
Guárico
-
Lara
-
Mérida
-
Miranda
-
Monagas
-
Nueva Esparta
-
Portuguesa
-
Sucre
-
Táchira
-
Trujillo
-
Vargas
-
Yaracuy
-
Zulia