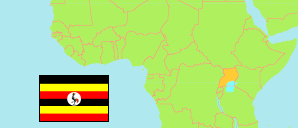
Kamwenge
District in Western Region
Contents: Subdivision
The population development in Kamwenge as well as related information and services (Wikipedia, Google, images).
| Name | Status | Population Projection 2015-07-01 | Population Projection 2020-07-01 | Population Projection 2023-07-01 | |
|---|---|---|---|---|---|
| Kamwenge | District | 278,900 | 335,200 | 372,000 | |
| Biguli | Subcounty | 35,300 | 42,400 | 47,100 | → |
| Bihanga | Subcounty | 14,700 | 17,800 | 19,700 | → |
| Busiriba | Subcounty | 28,900 | 34,800 | 38,500 | → |
| Bwizi | Subcounty | 29,600 | 35,700 | 39,500 | → |
| Kabambiro | Subcounty | 16,000 | 19,200 | 21,300 | → |
| Kahunge | Subcounty | 26,600 | 32,000 | 35,500 | → |
| Kahunge | Town Council | 10,900 | 13,000 | 14,500 | → |
| Kamwenge | Subcounty | 22,600 | 27,200 | 30,300 | → |
| Kamwenge | Town Council | 19,900 | 23,900 | 26,600 | → |
| Nkoma | Subcounty | 20,900 | 25,100 | 27,900 | → |
| Nkoma | Town Council | 12,000 | 14,400 | 16,100 | → |
| Rwamwanja Refugee Camp | Refugee Camp | 41,500 | 49,700 | 55,000 | → |
| Western | Region | 9,086,200 | 10,577,900 | 11,250,700 |
Source: Uganda Bureau of Statistics.
Explanation: Districts in 2024 boundaries. Subcounties as operational in mid-2019. The projections do not consider the population increase by refugees from neighboring countries like South Sudan.
