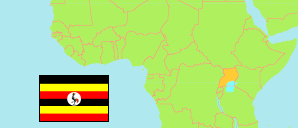
Chema
Subcounty in Eastern Region
Contents: Population
The population development of Chema as well as related information and services (Wikipedia, Google, images).
| Name | Status | Population Projection 2015-07-01 | Population Projection 2020-07-01 | Population Projection 2023-07-01 | |||||||||||||||
|---|---|---|---|---|---|---|---|---|---|---|---|---|---|---|---|---|---|---|---|
| Chema | Subcounty | 8,800 | 10,200 | 11,000 | |||||||||||||||
Chema 11,000 Population [2023] – Projection 29.82 km² Area 368.9/km² Population Density [2023] 2.5% Annual Population Change [2020 → 2023] | |||||||||||||||||||
| Eastern | Region | 9,269,800 | 10,836,500 | 11,830,700 | |||||||||||||||
Source: Uganda Bureau of Statistics.
Explanation: Districts in 2024 boundaries. Subcounties as operational in mid-2019. The projections do not consider the population increase by refugees from neighboring countries like South Sudan.
Further information about the population structure:
| Gender (P 2020) | |
|---|---|
| Males | 5,000 |
| Females | 5,200 |
