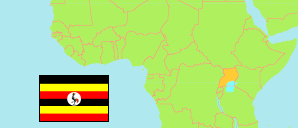
Mubende
District in Central Region
Contents: Subdivision
The population development in Mubende as well as related information and services (Wikipedia, Google, images).
| Name | Status | Population Projection 2015-07-01 | Population Projection 2020-07-01 | Population Projection 2023-07-01 | |
|---|---|---|---|---|---|
| Mubende | District | 430,200 | 554,800 | 641,800 | |
| Bagezza | Subcounty | 12,200 | 15,700 | 18,200 | → |
| Butoloogo | Subcounty | 46,200 | 59,600 | 69,000 | → |
| Eastern Division | Division | 28,800 | 37,200 | 43,100 | → |
| Kasambya | Subcounty | 27,700 | 35,700 | 41,300 | → |
| Kasambya | Town Council | 12,100 | 15,700 | 18,100 | → |
| Kibalinga | Subcounty | 37,700 | 48,700 | 56,300 | → |
| Kigando | Subcounty | 42,200 | 54,500 | 63,000 | → |
| Kitenga | Subcounty | 64,300 | 82,500 | 95,600 | → |
| Kiyuni | Subcounty | 17,500 | 22,700 | 26,200 | → |
| Madudu | Subcounty | 38,400 | 49,500 | 57,300 | → |
| Nabingoola | Subcounty | 37,700 | 48,600 | 56,200 | → |
| Southern Division | Division | 35,600 | 45,900 | 53,000 | → |
| Western Division | Division | 29,800 | 38,500 | 44,500 | → |
| Central (Buganda) | Region | 9,780,900 | 11,562,900 | 12,762,200 |
Source: Uganda Bureau of Statistics.
Explanation: Districts in 2024 boundaries. Subcounties as operational in mid-2019. The projections do not consider the population increase by refugees from neighboring countries like South Sudan.
