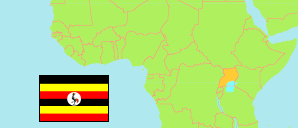
Kiboga
District in Uganda
Contents: Population
The population development of Kiboga as well as related information and services (Wikipedia, Google, images).
| Name | Status | Population Census 1991-01-12 | Population Census 2002-09-13 | Population Census 2014-08-27 | Population Projection 2020-07-01 | |
|---|---|---|---|---|---|---|
| Kiboga | District | 98,153 | 108,897 | 148,218 | 171,200 | |
| Uganda | Republic | 16,671,705 | 24,442,084 | 34,634,650 | 41,583,600 |
Source: Uganda Bureau of Statistics (web).
Explanation: Districts as operational in mid-2019. Area figures of districts are derived from spatial data. The urban figures refer to municipalities and towns as defined in 2019. The 2020 projection does not consider the population increase by refugees from neighboring countries like South Sudan.
Further information about the population structure:
| Gender (P 2020) | |
|---|---|
| Males | 88,600 |
| Females | 82,600 |
| Urbanization (P 2020) | |
|---|---|
| Rural | 124,500 |
| Urban | 46,700 |