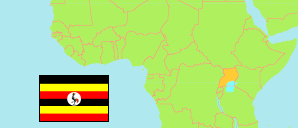
Bugisu
Subregion in Uganda
Contents: Subdivision
The population development in Bugisu as well as related information and services (Wikipedia, Google, images).
| Name | Status | Population Census 2014-08-27 | Population Census 2024-05-10 | |
|---|---|---|---|---|
| Bugisu | Subregion | 1,469,892 | 1,827,757 | |
| Bududa | District | 210,173 | 268,970 | → |
| Bulambuli | District | 174,513 | 235,391 | → |
| Manafwa | District | 149,544 | 186,917 | → |
| Mbale | District | 222,343 | 290,356 | → |
| Mbale City | City | 266,617 | 290,414 | → |
| Namisindwa | District | 204,281 | 257,346 | → |
| Sironko | District | 242,421 | 298,363 | → |
| Uganda | Republic | 34,634,650 | 45,905,417 |
Source: Uganda Bureau of Statistics.
Further information about the population structure:
| Gender (C 2024) | |
|---|---|
| Males | 863,719 |
| Females | 964,038 |
| Age Groups (C 2024) | |
|---|---|
| 0-17 years | 867,572 |
| 18-59 years | 844,321 |
| 60+ years | 115,864 |
