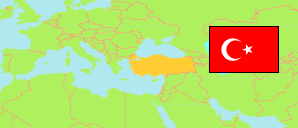
Bayburt
Province in Turkey
Contents: Subdivision
The population development in Bayburt as well as related information and services (Wikipedia, Google, images).
| Name | Status | Population Estimate 2009-12-31 | Population Estimate 2013-12-31 | Population Estimate 2017-12-31 | Population Estimate 2023-12-31 | |
|---|---|---|---|---|---|---|
| Bayburt | Province | 74,710 | 75,620 | 80,417 | 86,047 | |
| Aydıntepe | District | 6,785 | 6,484 | 6,354 | 7,070 | → |
| Demirözü | District | 8,799 | 8,156 | 7,835 | 8,072 | → |
| Merkez | District | 59,126 | 60,980 | 66,228 | 70,905 | → |
| Türkiye [Turkey] | Republic | 72,561,312 | 76,667,864 | 80,810,525 | 85,372,377 |
Source: State Institute of Statistics, Republic of Türkiye.
Explanation: Area figures of districts are computed by using geospatial data.
Further information about the population structure:
| Gender (E 2023) | |
|---|---|
| Males | 43,603 |
| Females | 42,444 |
| Age Groups (E 2023) | |
|---|---|
| 0-14 years | 15,718 |
| 15-64 years | 59,964 |
| 65+ years | 10,365 |
| Age Distribution (E 2023) | |
|---|---|
| 90+ years | 400 |
| 80-89 years | 1,758 |
| 70-79 years | 4,499 |
| 60-69 years | 7,835 |
| 50-59 years | 9,479 |
| 40-49 years | 9,859 |
| 30-39 years | 11,428 |
| 20-29 years | 17,863 |
| 10-19 years | 12,764 |
| 0-9 years | 10,162 |
