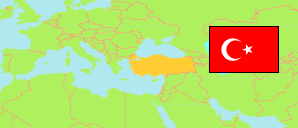
Giresun
Province in Turkey
Contents: Subdivision
The population development in Giresun as well as related information and services (Wikipedia, Google, images).
| Name | Status | Population Estimate 2009-12-31 | Population Estimate 2013-12-31 | Population Estimate 2017-12-31 | Population Estimate 2023-12-31 | |
|---|---|---|---|---|---|---|
| Giresun | Province | 421,860 | 425,007 | 437,393 | 461,712 | |
| Alucra | District | 9,255 | 9,170 | 9,119 | 10,514 | → |
| Bulancak | District | 60,053 | 61,833 | 65,024 | 70,092 | → |
| Çamoluk | District | 6,832 | 7,495 | 8,723 | 7,254 | → |
| Çanakçı | District | 7,666 | 6,959 | 6,297 | 6,917 | → |
| Dereli | District | 21,832 | 20,870 | 21,102 | 19,308 | → |
| Doğankent | District | 7,081 | 6,943 | 6,212 | 6,539 | → |
| Espiye | District | 31,384 | 31,794 | 33,043 | 38,130 | → |
| Eynesil | District | 14,036 | 13,399 | 12,923 | 13,237 | → |
| Görele | District | 30,501 | 29,713 | 29,806 | 32,192 | → |
| Güce | District | 8,658 | 8,354 | 7,918 | 8,574 | → |
| Keşap | District | 20,628 | 20,292 | 20,947 | 20,763 | → |
| Merkez | District | 119,181 | 124,144 | 134,937 | 143,890 | → |
| Piraziz | District | 14,041 | 13,587 | 13,251 | 15,151 | → |
| Şebinkarahisar | District | 22,417 | 23,193 | 22,088 | 19,948 | → |
| Tirebolu | District | 29,274 | 30,428 | 30,814 | 33,459 | → |
| Yağlıdere | District | 19,021 | 16,833 | 15,189 | 15,744 | → |
| Türkiye [Turkey] | Republic | 72,561,312 | 76,667,864 | 80,810,525 | 85,372,377 |
Source: State Institute of Statistics, Republic of Türkiye.
Explanation: Area figures of districts are computed by using geospatial data.
Further information about the population structure:
| Gender (E 2023) | |
|---|---|
| Males | 230,728 |
| Females | 230,984 |
| Age Groups (E 2023) | |
|---|---|
| 0-14 years | 70,535 |
| 15-64 years | 306,480 |
| 65+ years | 84,697 |
| Age Distribution (E 2023) | |
|---|---|
| 90+ years | 3,833 |
| 80-89 years | 15,321 |
| 70-79 years | 34,039 |
| 60-69 years | 66,181 |
| 50-59 years | 65,610 |
| 40-49 years | 60,919 |
| 30-39 years | 57,024 |
| 20-29 years | 59,815 |
| 10-19 years | 54,311 |
| 0-9 years | 44,659 |
