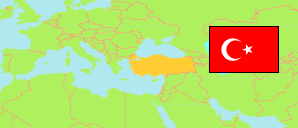
Kastamonu
Province in Turkey
Contents: Subdivision
The population development in Kastamonu as well as related information and services (Wikipedia, Google, images).
| Name | Status | Population Estimate 2009-12-31 | Population Estimate 2013-12-31 | Population Estimate 2017-12-31 | Population Estimate 2023-12-31 | |
|---|---|---|---|---|---|---|
| Kastamonu | Province | 359,823 | 368,093 | 372,373 | 388,990 | |
| Abana | District | 3,631 | 3,997 | 3,931 | 4,461 | → |
| Ağlı | District | 3,175 | 2,971 | 2,881 | 3,521 | → |
| Araç | District | 20,201 | 19,214 | 18,402 | 18,676 | → |
| Azdavay | District | 7,744 | 7,462 | 7,328 | 8,031 | → |
| Bozkurt | District | 8,943 | 9,337 | 9,439 | 9,738 | → |
| Çatalzeytin | District | 7,040 | 7,014 | 6,346 | 8,127 | → |
| Cide | District | 20,253 | 20,616 | 22,212 | 22,965 | → |
| Daday | District | 9,911 | 9,896 | 8,509 | 8,456 | → |
| Devrekani | District | 13,435 | 13,042 | 12,027 | 13,886 | → |
| Doğanyurt | District | 8,290 | 6,756 | 5,993 | 5,433 | → |
| Hanönü | District | 4,229 | 4,112 | 3,921 | 4,395 | → |
| İhsangazi | District | 5,931 | 5,984 | 5,415 | 5,235 | → |
| İnebolu | District | 23,794 | 22,841 | 21,716 | 20,480 | → |
| Küre | District | 7,191 | 6,792 | 5,877 | 5,644 | → |
| Merkez | District | 119,867 | 132,710 | 145,754 | 155,011 | → |
| Pınarbaşı | District | 5,071 | 6,231 | 5,236 | 6,970 | → |
| Şenpazar | District | 5,669 | 5,081 | 4,995 | 4,844 | → |
| Seydiler | District | 4,262 | 4,109 | 3,940 | 4,796 | → |
| Taşköprü | District | 40,292 | 39,400 | 38,171 | 38,372 | → |
| Tosya | District | 40,894 | 40,528 | 40,280 | 39,949 | → |
| Türkiye [Turkey] | Republic | 72,561,312 | 76,667,864 | 80,810,525 | 85,372,377 |
Source: State Institute of Statistics, Republic of Türkiye.
Explanation: Area figures of districts are computed by using geospatial data.
Further information about the population structure:
| Gender (E 2023) | |
|---|---|
| Males | 192,048 |
| Females | 196,942 |
| Age Groups (E 2023) | |
|---|---|
| 0-14 years | 58,041 |
| 15-64 years | 255,222 |
| 65+ years | 75,727 |
| Age Distribution (E 2023) | |
|---|---|
| 90+ years | 2,175 |
| 80-89 years | 12,887 |
| 70-79 years | 34,197 |
| 60-69 years | 55,240 |
| 50-59 years | 51,202 |
| 40-49 years | 51,664 |
| 30-39 years | 48,277 |
| 20-29 years | 50,693 |
| 10-19 years | 45,814 |
| 0-9 years | 36,841 |
