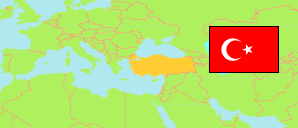
Ankara
Metropolitan Province in Turkey
Contents: Subdivision
The population development in Ankara as well as related information and services (Wikipedia, Google, images).
| Name | Status | Population Estimate 2009-12-31 | Population Estimate 2013-12-31 | Population Estimate 2017-12-31 | Population Estimate 2023-12-31 | |
|---|---|---|---|---|---|---|
| Ankara | Metropolitan Province | 4,650,802 | 5,045,083 | 5,445,026 | 5,803,482 | |
| Akyurt | District | 25,401 | 28,349 | 32,863 | 43,918 | → |
| Altındağ | District | 367,340 | 359,597 | 371,366 | 412,267 | → |
| Ayaş | District | 14,057 | 12,997 | 12,289 | 15,581 | → |
| Balâ | District | 23,822 | 23,138 | 21,682 | 28,704 | → |
| Beypazarı | District | 46,514 | 47,234 | 48,476 | 48,558 | → |
| Çamlıdere | District | 8,293 | 7,181 | 7,389 | 13,971 | → |
| Çankaya | District | 794,288 | 914,501 | 921,999 | 937,546 | → |
| Çubuk | District | 81,270 | 83,449 | 90,063 | 99,096 | → |
| Elmadağ | District | 42,503 | 43,873 | 45,513 | 45,034 | → |
| Etimesgut | District | 347,267 | 469,626 | 566,500 | 617,229 | → |
| Evren | District | 3,822 | 2,995 | 2,753 | 3,581 | → |
| Gölbaşı | District | 88,480 | 115,924 | 130,363 | 157,605 | → |
| Güdül | District | 9,393 | 8,921 | 8,050 | 10,014 | → |
| Haymana | District | 34,912 | 42,566 | 27,277 | 33,494 | → |
| Kahramankazan (Kazan) | District | 38,964 | 45,879 | 52,079 | 60,804 | → |
| Kalecik | District | 15,142 | 13,678 | 12,897 | 13,296 | → |
| Keçiören | District | 796,646 | 848,305 | 917,759 | 923,404 | → |
| Kızılcahamam | District | 25,522 | 26,694 | 24,947 | 31,800 | → |
| Mamak | District | 532,873 | 568,396 | 637,935 | 682,279 | → |
| Nallıhan | District | 30,970 | 29,797 | 28,621 | 26,831 | → |
| Polatlı | District | 115,457 | 117,393 | 124,464 | 128,895 | → |
| Pursaklar | District | 100,732 | 123,857 | 142,317 | 161,926 | → |
| Şereflikoçhisar | District | 35,978 | 34,577 | 33,599 | 34,122 | → |
| Sincan | District | 445,330 | 484,694 | 524,222 | 571,889 | → |
| Yenimahalle | District | 625,826 | 591,462 | 659,603 | 701,638 | → |
| Türkiye [Turkey] | Republic | 72,561,312 | 76,667,864 | 80,810,525 | 85,372,377 |
Source: State Institute of Statistics, Republic of Türkiye.
Explanation: Area figures of districts are computed by using geospatial data.
Further information about the population structure:
| Gender (E 2023) | |
|---|---|
| Males | 2,860,361 |
| Females | 2,943,121 |
| Age Groups (E 2023) | |
|---|---|
| 0-14 years | 1,109,888 |
| 15-64 years | 4,117,385 |
| 65+ years | 576,209 |
| Age Distribution (E 2023) | |
|---|---|
| 90+ years | 15,212 |
| 80-89 years | 88,065 |
| 70-79 years | 253,566 |
| 60-69 years | 503,432 |
| 50-59 years | 720,380 |
| 40-49 years | 901,875 |
| 30-39 years | 901,555 |
| 20-29 years | 899,343 |
| 10-19 years | 809,023 |
| 0-9 years | 711,031 |