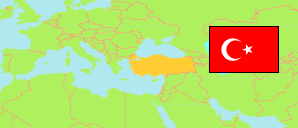
Sakarya
Metropolitan Province in Turkey
Contents: Subdivision
The population development in Sakarya as well as related information and services (Wikipedia, Google, images).
| Name | Status | Population Estimate 2009-12-31 | Population Estimate 2013-12-31 | Population Estimate 2017-12-31 | Population Estimate 2023-12-31 | |
|---|---|---|---|---|---|---|
| Sakarya | Metropolitan Province | 861,570 | 917,373 | 990,214 | 1,098,115 | |
| Adapazarı | District | 243,204 | 259,516 | 272,901 | 279,431 | → |
| Akyazı | District | 83,220 | 84,281 | 87,892 | 96,605 | → |
| Arifiye | District | 37,245 | 38,905 | 43,234 | 51,467 | → |
| Erenler | District | 72,475 | 78,094 | 85,649 | 91,611 | → |
| Ferizli | District | 23,877 | 24,585 | 25,909 | 32,752 | → |
| Geyve | District | 46,520 | 48,171 | 48,731 | 51,676 | → |
| Hendek | District | 74,084 | 76,134 | 81,635 | 91,486 | → |
| Karapürçek | District | 12,440 | 12,422 | 12,773 | 13,713 | → |
| Karasu | District | 53,842 | 55,342 | 62,866 | 73,738 | → |
| Kaynarca | District | 23,147 | 23,390 | 23,760 | 25,137 | → |
| Kocaali | District | 24,141 | 22,666 | 20,858 | 26,523 | → |
| Pamukova | District | 26,772 | 27,841 | 29,293 | 31,205 | → |
| Sapanca | District | 36,856 | 39,061 | 40,343 | 46,080 | → |
| Serdivan | District | 81,943 | 105,775 | 133,477 | 164,222 | → |
| Söğütlü | District | 14,255 | 14,055 | 14,044 | 15,411 | → |
| Taraklı | District | 7,549 | 7,135 | 6,849 | 7,058 | → |
| Türkiye [Turkey] | Republic | 72,561,312 | 76,667,864 | 80,810,525 | 85,372,377 |
Source: State Institute of Statistics, Republic of Türkiye.
Explanation: Area figures of districts are computed by using geospatial data.
Further information about the population structure:
| Gender (E 2023) | |
|---|---|
| Males | 550,484 |
| Females | 547,631 |
| Age Groups (E 2023) | |
|---|---|
| 0-14 years | 221,090 |
| 15-64 years | 757,258 |
| 65+ years | 119,767 |
| Age Distribution (E 2023) | |
|---|---|
| 90+ years | 2,781 |
| 80-89 years | 17,254 |
| 70-79 years | 52,988 |
| 60-69 years | 103,332 |
| 50-59 years | 133,616 |
| 40-49 years | 162,234 |
| 30-39 years | 157,870 |
| 20-29 years | 167,280 |
| 10-19 years | 154,807 |
| 0-9 years | 145,953 |
