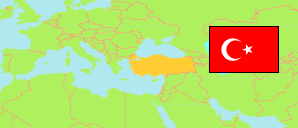
Kırklareli
Province in Turkey
Contents: Subdivision
The population development in Kırklareli as well as related information and services (Wikipedia, Google, images).
| Name | Status | Population Estimate 2009-12-31 | Population Estimate 2013-12-31 | Population Estimate 2017-12-31 | Population Estimate 2023-12-31 | |
|---|---|---|---|---|---|---|
| Kırklareli | Province | 333,179 | 340,559 | 356,050 | 377,156 | |
| Babaeski | District | 50,131 | 49,992 | 48,229 | 46,595 | → |
| Demirköy | District | 8,708 | 8,455 | 8,482 | 9,656 | → |
| Kofçaz | District | 2,879 | 2,702 | 2,434 | 2,308 | → |
| Lüleburgaz | District | 131,438 | 138,827 | 147,325 | 155,670 | → |
| Merkez | District | 86,663 | 89,509 | 100,116 | 112,323 | → |
| Pehlivanköy | District | 4,634 | 4,140 | 3,593 | 3,400 | → |
| Pınarhisar | District | 19,813 | 19,035 | 18,513 | 17,738 | → |
| Vize | District | 28,913 | 27,899 | 27,358 | 29,466 | → |
| Türkiye [Turkey] | Republic | 72,561,312 | 76,667,864 | 80,810,525 | 85,372,377 |
Source: State Institute of Statistics, Republic of Türkiye.
Explanation: Area figures of districts are computed by using geospatial data.
Further information about the population structure:
| Gender (E 2023) | |
|---|---|
| Males | 190,769 |
| Females | 186,387 |
| Age Groups (E 2023) | |
|---|---|
| 0-14 years | 57,050 |
| 15-64 years | 260,565 |
| 65+ years | 59,541 |
| Age Distribution (E 2023) | |
|---|---|
| 90+ years | 1,523 |
| 80-89 years | 9,296 |
| 70-79 years | 25,999 |
| 60-69 years | 47,845 |
| 50-59 years | 51,637 |
| 40-49 years | 57,054 |
| 30-39 years | 52,770 |
| 20-29 years | 52,518 |
| 10-19 years | 40,957 |
| 0-9 years | 37,557 |