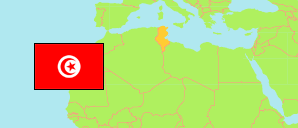
En-Nagr
Sector in Sousse Agglomeration
Contents: Population
The population development of En-Nagr as well as related information and services (Wikipedia, Google, images).
| Name | Status | Native | Population Census 2004-04-28 | Population Census 2014-04-23 | Population Census 2024-11-06 | |
|---|---|---|---|---|---|---|
| En-Nagr | Sector | النقر | 2,132 | 2,727 | 3,195 | |
| Sousse | Urban Agglomeration | سوسة | 821,741 | 1,016,882 | 1,123,607 |
Source: Institut National de la Statistique Tunisie.
Explanation: Municipalities in 2020 boundaries. Area figures are computed using geospatial data.
Further information about the population structure:
| Gender (C 2024) | |
|---|---|
| Males | 1,659 |
| Females | 1,536 |
| Age Groups (C 2024) | |
|---|---|
| 0-14 years | 815 |
| 15-64 years | 2,096 |
| 65+ years | 284 |
| Age Distribution (C 2024) | |
|---|---|
| 80+ years | 59 |
| 70-79 years | 109 |
| 60-69 years | 259 |
| 50-59 years | 350 |
| 40-49 years | 490 |
| 30-39 years | 417 |
| 20-29 years | 417 |
| 10-19 years | 612 |
| 0-9 years | 482 |
