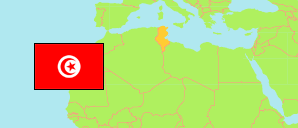
Gafsa
Governorate in Tunisia
Contents: Subdivision
The population development in Gafsa as well as related information and services (Wikipedia, Google, images).
| Name | Status | Native | Population Census 2004-04-28 | Population Census 2014-04-23 | Population Census 2024-11-06 | |
|---|---|---|---|---|---|---|
| Gafsa | Governorate | قفصة | 323,709 | 337,331 | 388,776 | |
| Belkhir | Delegation | بلخير | 15,159 | 14,784 | 15,923 | → |
| El Guettar | Delegation | القطار | 19,942 | 20,137 | 20,784 | → |
| El Ksar | Delegation | القصر | 32,186 | 36,482 | 39,931 | → |
| Gafsa Nord | Delegation | قفصة الشمالية | 9,407 | 10,022 | 11,657 | → |
| Gafsa Sud | Delegation | قفصة الجنوبية | 90,742 | 101,148 | 118,274 | → |
| Mdhila | Delegation | المضيلة | 14,841 | 15,306 | 16,883 | → |
| Métlaoui | Delegation | المتلوي | 38,938 | 38,634 | 44,547 | → |
| Moularès [Oum El Araies] | Delegation | أم العرائس | 27,393 | 22,798 | 31,767 | → |
| Redeyef | Delegation | الرديف | 27,940 | 26,976 | 31,421 | → |
| Sened | Delegation | السند | 20,138 | 21,487 | 23,633 | → |
| Sidi Aïch | Delegation | سيدي عيش | 8,297 | 10,084 | 12,029 | → |
| Sidi Boubaker [← Moularès] | Delegation | سيدي بوبكر | 4,340 | 4,214 | 5,402 | → |
| Zannouch [← Sened] | Delegation | زانوش | 14,386 | 15,259 | 16,525 | → |
| Tunisie [Tunisia] | Republic | تونس | 9,910,872 | 10,982,754 | 11,972,169 |
Source: Institut National de la Statistique Tunisie.
Explanation: Area figures are computed using geospatial data.
Further information about the population structure:
| Gender (C 2024) | |
|---|---|
| Males | 191,654 |
| Females | 197,122 |
| Age Groups (C 2024) | |
|---|---|
| 0-14 years | 98,034 |
| 15-64 years | 250,756 |
| 65+ years | 39,986 |
| Age Distribution (C 2024) | |
|---|---|
| 80+ years | 8,299 |
| 70-79 years | 16,342 |
| 60-69 years | 35,102 |
| 50-59 years | 43,503 |
| 40-49 years | 56,899 |
| 30-39 years | 58,287 |
| 20-29 years | 44,339 |
| 10-19 years | 62,398 |
| 0-9 years | 63,607 |