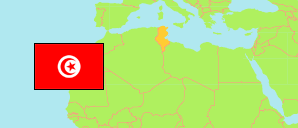
Siliana
Governorate in Tunisia
Contents: Subdivision
The population development in Siliana as well as related information and services (Wikipedia, Google, images).
| Name | Status | Native | Population Census 2004-04-28 | Population Census 2014-04-23 | Population Census 2024-11-06 | |
|---|---|---|---|---|---|---|
| Siliana | Governorate | سليانة | 233,985 | 223,087 | 216,242 | |
| Bargou | Delegation | برقو | 13,823 | 12,482 | 11,505 | → |
| Bou Arada | Delegation | بوعرادة | 20,877 | 20,444 | 19,373 | → |
| El Aroussa | Delegation | العروسة | 9,783 | 9,907 | 8,839 | → |
| El Krib | Delegation | الكريب | 21,546 | 20,155 | 20,000 | → |
| Gaâfour | Delegation | قعفور | 17,963 | 16,934 | 15,801 | → |
| Kesra | Delegation | كسرى | 17,763 | 16,404 | 15,031 | → |
| Makthar | Delegation | مكثر | 31,139 | 29,052 | 28,321 | → |
| Rouhia | Delegation | الروحية | 29,991 | 25,951 | 27,063 | → |
| Sidi Bou Rouis | Delegation | بورويس | 15,712 | 12,618 | 11,555 | → |
| Siliana Nord | Delegation | سليانة الشمالية | 26,102 | 28,907 | 28,801 | → |
| Siliana Sud | Delegation | سليانة الجنوبية | 29,286 | 30,233 | 29,953 | → |
| Tunisie [Tunisia] | Republic | تونس | 9,910,872 | 10,982,754 | 11,972,169 |
Source: Institut National de la Statistique Tunisie.
Explanation: Area figures are computed using geospatial data.
Further information about the population structure:
| Gender (C 2024) | |
|---|---|
| Males | 106,803 |
| Females | 109,439 |
| Age Groups (C 2024) | |
|---|---|
| 0-14 years | 50,709 |
| 15-64 years | 135,084 |
| 65+ years | 30,449 |
| Age Distribution (C 2024) | |
|---|---|
| 80+ years | 7,144 |
| 70-79 years | 12,861 |
| 60-69 years | 22,647 |
| 50-59 years | 26,641 |
| 40-49 years | 30,979 |
| 30-39 years | 27,077 |
| 20-29 years | 21,379 |
| 10-19 years | 36,593 |
| 0-9 years | 30,921 |
