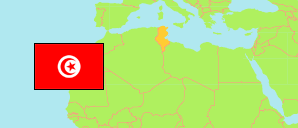
Jendouba
Governorate in Tunisia
Contents: Subdivision
The population development in Jendouba as well as related information and services (Wikipedia, Google, images).
| Name | Status | Native | Population Census 2004-04-28 | Population Census 2014-04-23 | Population Census 2024-11-06 | |
|---|---|---|---|---|---|---|
| Jendouba | Governorate | جندوبة | 416,608 | 401,477 | 404,352 | |
| Aïn Draham | Delegation | عين دراهم | 40,372 | 35,400 | 32,306 | → |
| Balta - Bou Aouane | Delegation | بلطة بوعوان | 42,229 | 38,764 | 36,465 | → |
| Bou Salem | Delegation | بوسالم | 36,061 | 35,501 | 37,100 | → |
| Fernana | Delegation | فرنانة | 52,690 | 47,690 | 47,917 | → |
| Ghardimaou | Delegation | غار الدماء | 67,955 | 64,170 | 62,313 | → |
| Jendouba [Jendouba Sud] | Delegation | جندوبة | 68,597 | 72,337 | 77,342 | → |
| Jendouba Nord | Delegation | جندوبة الشمالية | 44,195 | 40,779 | 44,687 | → |
| Oued Meliz | Delegation | وادي مليز | 19,015 | 17,843 | 17,334 | → |
| Tabarka | Delegation | طبرقة | 45,494 | 48,993 | 48,888 | → |
| Tunisie [Tunisia] | Republic | تونس | 9,910,872 | 10,982,754 | 11,972,169 |
Source: Institut National de la Statistique Tunisie.
Explanation: Area figures are computed using geospatial data.
Further information about the population structure:
| Gender (C 2024) | |
|---|---|
| Males | 198,221 |
| Females | 206,131 |
| Age Groups (C 2024) | |
|---|---|
| 0-14 years | 84,196 |
| 15-64 years | 258,002 |
| 65+ years | 62,154 |
| Age Distribution (C 2024) | |
|---|---|
| 80+ years | 13,416 |
| 70-79 years | 26,925 |
| 60-69 years | 48,085 |
| 50-59 years | 53,131 |
| 40-49 years | 56,651 |
| 30-39 years | 50,694 |
| 20-29 years | 42,519 |
| 10-19 years | 60,861 |
| 0-9 years | 52,070 |