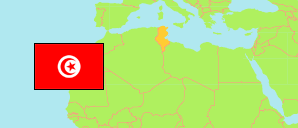
Nabeul
Governorate in Tunisia
Contents: Subdivision
The population development in Nabeul as well as related information and services (Wikipedia, Google, images).
| Name | Status | Native | Population Census 2004-04-28 | Population Census 2014-04-23 | Population Census 2024-11-06 | |
|---|---|---|---|---|---|---|
| Nabeul | Governorate | نابل | 693,890 | 787,920 | 863,172 | |
| Béni Khalled | Delegation | بني خلاد | 33,897 | 37,964 | 41,935 | → |
| Béni Khiar | Delegation | بني خيار | 35,565 | 43,132 | 47,521 | → |
| Bou Argoub | Delegation | بوعرقوب | 27,846 | 30,942 | 35,243 | → |
| Dar Châabane El Fehri | Delegation | دار شعبان الفهري | 39,477 | 46,781 | 51,174 | → |
| El Haouaria | Delegation | الهوارية | 39,378 | 41,317 | 46,080 | → |
| El Mida | Delegation | الميدة | 23,667 | 26,995 | 29,179 | → |
| Grombalia | Delegation | قرمبالية | 55,489 | 67,475 | 75,855 | → |
| Hammamet | Delegation | الحمامات | 95,468 | 97,855 | 96,181 | → |
| Hammam Ghezèze | Delegation | حمام الأغزاز | 14,324 | 15,727 | 17,278 | → |
| Kélibia | Delegation | قليببية | 53,648 | 58,491 | 66,919 | → |
| Korba | Delegation | قربة | 60,564 | 68,966 | 74,063 | → |
| Menzel Bouzelfa | Delegation | منزل بوزلفة | 33,599 | 37,860 | 39,839 | → |
| Menzel Temime | Delegation | منزل تميم | 59,463 | 65,645 | 72,104 | → |
| Nabeul | Delegation | نابل | 59,490 | 73,128 | 72,776 | → |
| Soliman | Delegation | سليمان | 41,846 | 53,491 | 72,220 | → |
| Takelsa | Delegation | تاكلسة | 20,169 | 22,151 | 24,805 | → |
| Tunisie [Tunisia] | Republic | تونس | 9,910,872 | 10,982,754 | 11,972,169 |
Source: Institut National de la Statistique Tunisie.
Explanation: Area figures are computed using geospatial data.
Further information about the population structure:
| Gender (C 2024) | |
|---|---|
| Males | 433,224 |
| Females | 429,948 |
| Age Groups (C 2024) | |
|---|---|
| 0-14 years | 186,367 |
| 15-64 years | 577,436 |
| 65+ years | 99,369 |
| Age Distribution (C 2024) | |
|---|---|
| 80+ years | 19,369 |
| 70-79 years | 42,536 |
| 60-69 years | 86,268 |
| 50-59 years | 109,384 |
| 40-49 years | 127,034 |
| 30-39 years | 119,706 |
| 20-29 years | 106,035 |
| 10-19 years | 140,608 |
| 0-9 years | 112,232 |
