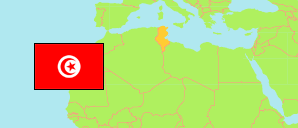
Tunis
Governorate in Tunisia
Contents: Subdivision
The population development in Tunis as well as related information and services (Wikipedia, Google, images).
| Name | Status | Native | Population Census 2004-04-28 | Population Census 2014-04-23 | Population Census 2024-11-06 | |
|---|---|---|---|---|---|---|
| Tunis | Governorate | تونس | 983,861 | 1,056,247 | 1,075,306 | |
| Bab El Bhar | Delegation | باب البحر | 39,806 | 36,210 | 30,322 | → |
| Bab Souika | Delegation | باب سويقة | 33,284 | 29,185 | 25,142 | → |
| Carthage | Delegation | قرطاج | 20,715 | 24,216 | 22,203 | → |
| Cité El Khadra | Delegation | حي الخضراء | 36,818 | 35,173 | 30,345 | → |
| Djebel Jelloud [Djebel Djelloud] | Delegation | جبل الجلود | 26,490 | 23,638 | 24,183 | → |
| El Hraïria | Delegation | الحرائرية | 96,245 | 110,184 | 118,229 | → |
| El Kabaria | Delegation | الكبارية | 81,261 | 86,024 | 83,856 | → |
| El Menzah | Delegation | المنزه | 43,320 | 41,830 | 40,738 | → |
| El Omrane | Delegation | العمران | 40,801 | 42,208 | 37,678 | → |
| El Omrane Supérieur | Delegation | العمران الاعلى | 62,138 | 55,513 | 57,993 | → |
| El Ouardia | Delegation | الوردية | 33,734 | 32,147 | 30,143 | → |
| Ettahrir | Delegation | التحرير | 21,956 | 21,709 | 19,679 | → |
| Ezzouhour | Delegation | الزهور | 40,434 | 40,728 | 35,484 | → |
| La Goulette | Delegation | حلق الوادي | 28,407 | 45,711 | 48,382 | → |
| La Marsa | Delegation | المرسى | 77,890 | 92,987 | 113,133 | → |
| Le Bardo | Delegation | باردو | 70,244 | 71,961 | 68,799 | → |
| Le Kram | Delegation | الكرم | 58,152 | 74,132 | 88,302 | → |
| Medina | Delegation | المدينة | 26,703 | 21,400 | 17,376 | → |
| Séjoumi [Sijoumi] | Delegation | السيجومي | 36,171 | 33,870 | 28,387 | → |
| Sidi El Béchir | Delegation | سيدي البشير | 29,911 | 27,749 | 25,044 | → |
| Sidi Hassine | Delegation | سيدي حسين | 79,381 | 109,672 | 129,888 | → |
| Tunisie [Tunisia] | Republic | تونس | 9,910,872 | 10,982,754 | 11,972,169 |
Source: Institut National de la Statistique Tunisie.
Explanation: Area figures are computed using geospatial data.
Further information about the population structure:
| Gender (C 2024) | |
|---|---|
| Males | 528,652 |
| Females | 546,654 |
| Age Groups (C 2024) | |
|---|---|
| 0-14 years | 189,679 |
| 15-64 years | 744,669 |
| 65+ years | 140,958 |
| Age Distribution (C 2024) | |
|---|---|
| 80+ years | 25,624 |
| 70-79 years | 62,528 |
| 60-69 years | 123,210 |
| 50-59 years | 141,749 |
| 40-49 years | 158,933 |
| 30-39 years | 155,424 |
| 20-29 years | 146,203 |
| 10-19 years | 148,660 |
| 0-9 years | 112,975 |
