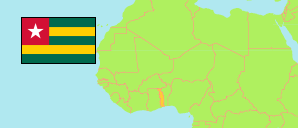
Sotouboua
Prefecture in Togo
Contents: Subdivision
The population in Sotouboua as well as related information and services (Wikipedia, Google, images).
| Name | Status | Population Census 2022-11-08 | |
|---|---|---|---|
| Sotouboua | Prefecture | 138,864 | |
| Sotouboua 1 | Commune | 46,907 | → |
| Sotouboua 2 | Commune | 64,187 | → |
| Sotouboua 3 | Commune | 27,770 | → |
| Togo | Republic | 8,095,498 |
Source: Direction Générale de la Statistique et de la Comptabilité Nationale, République Togolaise.
Explanation: Area figures are calculated by geospatial data.
Further information about the population structure:
| Gender (C 2022) | |
|---|---|
| Males | 69,140 |
| Females | 69,724 |
| Age Groups (C 2022) | |
|---|---|
| 0-14 years | 56,642 |
| 15-64 years | 76,269 |
| 65+ years | 5,516 |
| Age Distribution (C 2022) | |
|---|---|
| 80+ years | 1,399 |
| 70-79 years | 2,298 |
| 60-69 years | 4,981 |
| 50-59 years | 9,373 |
| 40-49 years | 12,120 |
| 30-39 years | 17,006 |
| 20-29 years | 20,216 |
| 10-19 years | 32,775 |
| 0-9 years | 38,259 |
| Urbanization (C 2022) | |
|---|---|
| Rural | 106,400 |
| Urban | 32,464 |