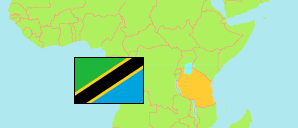
Maswa
District in Lake Zone
Contents: Subdivision
The population in Maswa as well as related information and services (Wikipedia, Google, images).
| Name | Status | Population Census 2022-08-23 | |
|---|---|---|---|
| Maswa | District | 427,864 | |
| Badi | Rural Ward | 20,937 | → |
| Binza | Mixed Ward | 8,787 | → |
| Buchambi | Rural Ward | 15,498 | → |
| Budekwa | Rural Ward | 9,230 | → |
| Bugarama | Rural Ward | 9,727 | → |
| Busangi | Rural Ward | 10,074 | → |
| Busilili | Rural Ward | 9,986 | → |
| Dakama | Rural Ward | 5,420 | → |
| Ipililo | Rural Ward | 23,155 | → |
| Isanga | Rural Ward | 11,418 | → |
| Jija | Rural Ward | 14,097 | → |
| Kadoto | Rural Ward | 16,158 | → |
| Kulimi | Rural Ward | 6,144 | → |
| Lalago | Mixed Ward | 13,253 | → |
| Malampaka | Mixed Ward | 13,765 | → |
| Masela | Rural Ward | 15,250 | → |
| Mataba | Rural Ward | 7,340 | → |
| Mbaragane | Rural Ward | 15,299 | → |
| Mpindo | Rural Ward | 14,633 | → |
| Mwabaratulu | Rural Ward | 6,825 | → |
| Mwabayanda | Rural Ward | 11,113 | → |
| Mwamanenge | Rural Ward | 9,586 | → |
| Mwamashimba | Rural Ward | 11,193 | → |
| Mwang'honoli | Rural Ward | 12,176 | → |
| Nguliguli | Rural Ward | 10,572 | → |
| Ng'wigwa | Rural Ward | 12,696 | → |
| Nyabubinza | Rural Ward | 11,525 | → |
| Nyalikungu | Mixed Ward | 9,534 | → |
| Sangamwalugesha | Mixed Ward | 10,465 | → |
| Senani | Rural Ward | 13,724 | → |
| Seng'wa | Rural Ward | 12,332 | → |
| Shanwa | Mixed Ward | 12,618 | → |
| Shishiyu | Rural Ward | 15,582 | → |
| Sola | Mixed Ward | 7,601 | → |
| Sukuma | Rural Ward | 13,481 | → |
| Zanzui | Rural Ward | 6,670 | → |
| Lake | Zone | 18,891,557 |
Source: National Bureau of Statistics Tanzania.
Explanation: Area figures are derived from geospatial data.