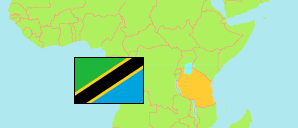
Mtama
District in Coastal Tanzania
Contents: Subdivision
The population in Mtama as well as related information and services (Wikipedia, Google, images).
| Name | Status | Population Census 2022-08-23 | |
|---|---|---|---|
| Mtama (← Lindi Rural) | District | 166,493 | |
| Chiponda | Rural Ward | 7,007 | → |
| Kiwalala | Mixed Ward | 16,446 | → |
| Longa | Rural Ward | 3,500 | → |
| Majengo | Mixed Ward | 8,324 | → |
| Mandwanga | Rural Ward | 13,035 | → |
| Mnara | Rural Ward | 11,590 | → |
| Mnolela | Rural Ward | 16,260 | → |
| Mtama | Mixed Ward | 5,422 | → |
| Mtua | Rural Ward | 4,236 | → |
| Mtumbya | Rural Ward | 2,234 | → |
| Nachunyu | Rural Ward | 9,753 | → |
| Nahukahuka | Rural Ward | 6,886 | → |
| Namangwale (Namangale) | Rural Ward | 7,404 | → |
| Namupa | Rural Ward | 6,274 | → |
| Navanga | Rural Ward | 5,129 | → |
| Nyangamara | Rural Ward | 9,440 | → |
| Nyangao | Mixed Ward | 11,920 | → |
| Nyengedi | Rural Ward | 6,514 | → |
| Pangatena | Rural Ward | 6,992 | → |
| Sudi | Rural Ward | 8,127 | → |
| Coastal | Zone | 13,434,754 |
Source: National Bureau of Statistics Tanzania.
Explanation: Area figures are derived from geospatial data.