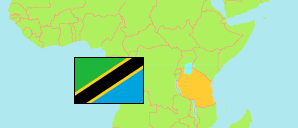
Chemba
District in Central Tanzania
Contents: Subdivision
The population in Chemba as well as related information and services (Wikipedia, Google, images).
| Name | Status | Population Census 2022-08-23 | |
|---|---|---|---|
| Chemba | District | 339,333 | |
| Babayu | Rural Ward | 11,331 | → |
| Chandama | Rural Ward | 10,511 | → |
| Chemba | Mixed Ward | 9,730 | → |
| Churuku | Rural Ward | 9,635 | → |
| Dalai | Rural Ward | 18,195 | → |
| Farkwa | Rural Ward | 15,616 | → |
| Goima | Rural Ward | 14,985 | → |
| Gwandi | Rural Ward | 7,328 | → |
| Jangalo | Rural Ward | 21,713 | → |
| Kidoka | Rural Ward | 16,378 | → |
| Kimaha | Rural Ward | 13,435 | → |
| Kinyamsindo | Rural Ward | 7,001 | → |
| Kwamtoro | Rural Ward | 17,657 | → |
| Lahoda | Rural Ward | 20,584 | → |
| Lalta | Rural Ward | 5,781 | → |
| Makorongo | Rural Ward | 8,640 | → |
| Mondo | Rural Ward | 10,986 | → |
| Mpendo | Rural Ward | 11,861 | → |
| Mrijo | Mixed Ward | 27,777 | → |
| Msaada | Rural Ward | 7,314 | → |
| Ovada | Rural Ward | 8,318 | → |
| Paranga | Rural Ward | 17,613 | → |
| Sanzawa | Rural Ward | 15,970 | → |
| Songoro | Rural Ward | 13,078 | → |
| Soya | Mixed Ward | 12,868 | → |
| Tumbakose | Rural Ward | 5,028 | → |
| Central | Zone | 8,485,362 |
Source: National Bureau of Statistics Tanzania.
Explanation: Area figures are derived from geospatial data.