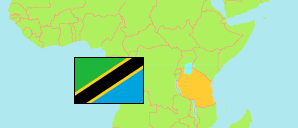
Chamwino
District in Tanzania
Contents: Population
The population development of Chamwino as well as related information and services (Wikipedia, Google, images).
| Name | Status | Population Census 1988-08-27 | Population Census 2002-08-01 | Population Census 2012-08-26 | Population Census 2022-08-23 | |
|---|---|---|---|---|---|---|
| Chamwino | District | ... | ... | 330,543 | 486,176 | |
| Tanzania | United Republic | 23,174,336 | 34,443,603 | 44,928,923 | 61,741,120 |
Source: National Bureau of Statistics Tanzania.
Explanation: Area figures of districts are calculated from geospatial data.
Further information about the population structure:
| Gender (C 2022) | |
|---|---|
| Males | 236,583 |
| Females | 249,593 |
| Urbanization (C 2022) | |
|---|---|
| Rural | 462,489 |
| Urban | 23,687 |
| Age Groups (C 2022) | |
|---|---|
| 0-14 years | 218,295 |
| 15-64 years | 242,010 |
| 65+ years | 25,871 |
| Age Distribution (C 2022) | |
|---|---|
| 80+ years | 8,946 |
| 70-79 years | 10,540 |
| 60-69 years | 16,461 |
| 50-59 years | 27,402 |
| 40-49 years | 37,896 |
| 30-39 years | 48,798 |
| 20-29 years | 68,031 |
| 10-19 years | 115,443 |
| 0-9 years | 152,659 |