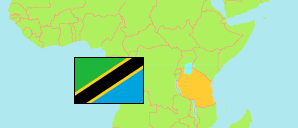
Dar es Salaam City
Tanzania
Contents: Population
The population development of Dar es Salaam City as well as related information and services (Wikipedia, Google, images).
| Name | Status | Population Census 1988-08-27 | Population Census 2002-08-01 | Population Census 2012-08-26 | Population Census 2022-08-23 | |
|---|---|---|---|---|---|---|
| Dar es Salaam City (Ilala Municipal) | City | 331,663 | 634,924 | 1,220,611 | 1,649,912 | |
| Tanzania | United Republic | 23,174,336 | 34,443,603 | 44,928,923 | 61,741,120 |
Source: National Bureau of Statistics Tanzania.
Explanation: Area figures of districts are calculated from geospatial data.
Further information about the population structure:
| Gender (C 2022) | |
|---|---|
| Males | 793,731 |
| Females | 856,181 |
| Urbanization (C 2022) | |
|---|---|
| Urban | 1,649,912 |
| Age Groups (C 2022) | |
|---|---|
| 0-14 years | 543,203 |
| 15-64 years | 1,066,407 |
| 65+ years | 40,302 |
| Age Distribution (C 2022) | |
|---|---|
| 80+ years | 7,972 |
| 70-79 years | 17,212 |
| 60-69 years | 40,528 |
| 50-59 years | 82,804 |
| 40-49 years | 168,434 |
| 30-39 years | 264,851 |
| 20-29 years | 359,894 |
| 10-19 years | 324,997 |
| 0-9 years | 383,220 |
