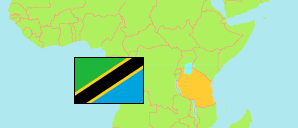
Katavi
Region in Tanzania
Contents: Subdivision
The population development in Katavi as well as related information and services (Wikipedia, Google, images).
| Name | Status | Population Census 1988-08-27 | Population Census 2002-08-01 | Population Census 2012-08-26 | Population Census 2022-08-23 | |
|---|---|---|---|---|---|---|
| Katavi | Region | ... | 408,609 | 564,604 | 1,152,958 | |
| Mlele | District | ... | ... | 34,698 | 118,818 | → |
| Mpanda Municipal | Municipality | ... | ... | 102,900 | 245,764 | → |
| Mpimbwe (← Mlele) | District | ... | ... | 103,625 | 215,438 | → |
| Nsimbo (← Mlele) | District | ... | ... | 144,245 | 201,102 | → |
| Tanganyika (Mpanda Rural) | District | ... | ... | 179,136 | 371,836 | → |
| Tanzania | United Republic | 23,174,336 | 34,443,603 | 44,928,923 | 61,741,120 |
Source: National Bureau of Statistics Tanzania.
Explanation: Area figures of districts are calculated from geospatial data.
Further information about the population structure:
| Gender (C 2022) | |
|---|---|
| Males | 569,902 |
| Females | 583,056 |
| Urbanization (C 2022) | |
|---|---|
| Rural | 883,999 |
| Urban | 268,959 |
| Age Groups (C 2022) | |
|---|---|
| 0-14 years | 576,514 |
| 15-64 years | 549,719 |
| 65+ years | 26,725 |
| Age Distribution (C 2022) | |
|---|---|
| 80+ years | 6,388 |
| 70-79 years | 11,542 |
| 60-69 years | 23,505 |
| 50-59 years | 39,656 |
| 40-49 years | 73,957 |
| 30-39 years | 122,011 |
| 20-29 years | 185,544 |
| 10-19 years | 275,919 |
| 0-9 years | 414,436 |