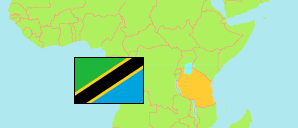
Mbeya
Region in Tanzania
Contents: Subdivision
The population development in Mbeya as well as related information and services (Wikipedia, Google, images).
| Name | Status | Population Census 1988-08-27 | Population Census 2002-08-01 | Population Census 2012-08-26 | Population Census 2022-08-23 | |
|---|---|---|---|---|---|---|
| Mbeya | Region | ... | 1,339,848 | 1,708,548 | 2,343,754 | |
| Busekelo (← Rungwe) | District | ... | ... | 96,348 | 100,123 | → |
| Chunya | District | ... | 105,882 | 156,786 | 344,471 | → |
| Kyela | District | 135,091 | 173,830 | 221,490 | 266,426 | → |
| Mbarali | District | 153,182 | 234,101 | 300,517 | 446,336 | → |
| Mbeya City | City | 151,881 | 265,586 | 385,279 | 541,603 | → |
| Mbeya Rural | District | 179,900 | 254,069 | 305,319 | 371,259 | → |
| Rungwe | District | ... | ... | 242,809 | 273,536 | → |
| Tanzania | United Republic | 23,174,336 | 34,443,603 | 44,928,923 | 61,741,120 |
Source: National Bureau of Statistics Tanzania.
Explanation: Area figures of districts are calculated from geospatial data.
Further information about the population structure:
| Gender (C 2022) | |
|---|---|
| Males | 1,123,828 |
| Females | 1,219,926 |
| Urbanization (C 2022) | |
|---|---|
| Rural | 1,419,206 |
| Urban | 924,548 |
| Age Groups (C 2022) | |
|---|---|
| 0-14 years | 945,140 |
| 15-64 years | 1,304,845 |
| 65+ years | 93,769 |
| Age Distribution (C 2022) | |
|---|---|
| 80+ years | 26,029 |
| 70-79 years | 39,866 |
| 60-69 years | 71,652 |
| 50-59 years | 113,465 |
| 40-49 years | 196,256 |
| 30-39 years | 288,796 |
| 20-29 years | 424,161 |
| 10-19 years | 520,107 |
| 0-9 years | 663,422 |