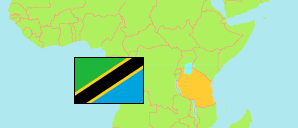
Ruvuma
Region in Tanzania
Contents: Subdivision
The population development in Ruvuma as well as related information and services (Wikipedia, Google, images).
| Name | Status | Population Census 1988-08-27 | Population Census 2002-08-01 | Population Census 2012-08-26 | Population Census 2022-08-23 | |
|---|---|---|---|---|---|---|
| Ruvuma | Region | 779,875 | 1,113,715 | 1,376,891 | 1,848,794 | |
| Madaba (← Songea Rural) | District | ... | ... | 47,774 | 65,215 | → |
| Mbinga Rural | District | ... | ... | 235,969 | 285,582 | → |
| Mbinga Town (← Mbinga Rural) | Town | ... | ... | 117,714 | 158,896 | → |
| Namtumbo | District | 137,038 | 175,051 | 201,639 | 271,368 | → |
| Nyasa | District | ... | ... | 146,160 | 191,193 | → |
| Songea Municipal | Municipality | ... | ... | 203,309 | 286,285 | → |
| Songea Rural | District | ... | ... | 126,047 | 178,201 | → |
| Tunduru | District | 170,320 | 247,055 | 298,279 | 412,054 | → |
| Tanzania | United Republic | 23,174,336 | 34,443,603 | 44,928,923 | 61,741,120 |
Source: National Bureau of Statistics Tanzania.
Explanation: Area figures of districts are calculated from geospatial data.
Further information about the population structure:
| Gender (C 2022) | |
|---|---|
| Males | 902,298 |
| Females | 946,496 |
| Urbanization (C 2022) | |
|---|---|
| Rural | 1,421,965 |
| Urban | 426,829 |
| Age Groups (C 2022) | |
|---|---|
| 0-14 years | 739,611 |
| 15-64 years | 1,028,936 |
| 65+ years | 80,247 |
| Age Distribution (C 2022) | |
|---|---|
| 80+ years | 20,403 |
| 70-79 years | 34,497 |
| 60-69 years | 65,789 |
| 50-59 years | 108,268 |
| 40-49 years | 168,313 |
| 30-39 years | 226,759 |
| 20-29 years | 298,290 |
| 10-19 years | 417,917 |
| 0-9 years | 508,558 |