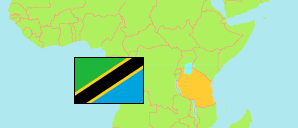
Morogoro
Region in Tanzania
Contents: Subdivision
The population development in Morogoro as well as related information and services (Wikipedia, Google, images).
| Name | Status | Population Census 1988-08-27 | Population Census 2002-08-01 | Population Census 2012-08-26 | Population Census 2022-08-23 | |
|---|---|---|---|---|---|---|
| Morogoro | Region | 1,220,564 | 1,753,362 | 2,218,492 | 3,197,104 | |
| Gairo | District | ... | ... | 193,011 | 258,205 | → |
| Ifakara Town (← Kilombero) | Town | ... | 80,243 | 114,202 | 290,424 | → |
| Kilosa | District | ... | ... | 438,175 | 617,032 | → |
| Malinyi (← Ulanga) | District | ... | 194,378 | 226,680 | 225,126 | → |
| Mlimba (← Kilombero) | District | ... | 127,233 | 181,200 | 292,536 | → |
| Morogoro Municipal | Municipality | 117,601 | 227,921 | 315,866 | 471,409 | → |
| Morogoro Rural | District | 225,857 | 263,012 | 286,248 | 387,736 | → |
| Mvomero | District | 204,345 | 259,347 | 312,109 | 421,741 | → |
| Ulanga | District | ... | 113,037 | 151,001 | 232,895 | → |
| Tanzania | United Republic | 23,174,336 | 34,443,603 | 44,928,923 | 61,741,120 |
Source: National Bureau of Statistics Tanzania.
Explanation: Area figures of districts are calculated from geospatial data.
Further information about the population structure:
| Gender (C 2022) | |
|---|---|
| Males | 1,579,869 |
| Females | 1,617,235 |
| Urbanization (C 2022) | |
|---|---|
| Rural | 1,947,832 |
| Urban | 1,249,272 |
| Age Groups (C 2022) | |
|---|---|
| 0-14 years | 1,275,751 |
| 15-64 years | 1,788,345 |
| 65+ years | 133,008 |
| Age Distribution (C 2022) | |
|---|---|
| 80+ years | 33,078 |
| 70-79 years | 57,788 |
| 60-69 years | 109,724 |
| 50-59 years | 179,072 |
| 40-49 years | 289,844 |
| 30-39 years | 401,311 |
| 20-29 years | 537,637 |
| 10-19 years | 702,589 |
| 0-9 years | 886,061 |
