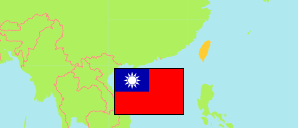
Taidong
County (Xian) in Taiwan
Contents: Subdivision
The population development in Taidong as well as related information and services (Wikipedia, Google, images).
| Name | Status | Native | Population Estimate 1981-12-31 | Population Estimate 1991-12-31 | Population Estimate 2001-12-31 | Population Estimate 2011-12-31 | Population Census 2020-11-01 | |
|---|---|---|---|---|---|---|---|---|
| Taidong [Taitung] | County (Xian) | 臺東縣 | 281,100 | 255,887 | 244,612 | 228,290 | 189,452 | |
| Beinan | Rural Township (Xiang) | 卑南鄉 | 24,420 | 21,534 | 20,057 | 18,055 | 16,789 | → |
| Changbin | Rural Township (Xiang) | 長濱鄉 | 15,134 | 12,368 | 10,228 | 8,031 | 4,691 | → |
| Chenggong | Urban Township (Zhen) | 成功鎮 | 24,070 | 20,643 | 18,469 | 15,542 | 9,305 | → |
| Chishang [Chihshang] | Rural Township (Xiang) | 池上鄉 | 14,109 | 11,772 | 10,508 | 9,012 | 6,071 | → |
| Daren | Rural Township (Xiang) | 達仁鄉 | 4,593 | 4,170 | 4,203 | 3,965 | 1,695 | → |
| Dawu | Rural Township (Xiang) | 大武鄉 | 8,403 | 7,350 | 6,739 | 6,790 | 2,846 | → |
| Donghe | Rural Township (Xiang) | 東河鄉 | 17,206 | 13,629 | 10,998 | 9,222 | 7,376 | → |
| Guanshan | Urban Township (Zhen) | 關山鎮 | 13,636 | 11,947 | 10,962 | 9,559 | 7,463 | → |
| Haiduan | Rural Township (Xiang) | 海端鄉 | 5,154 | 5,022 | 4,786 | 4,408 | 2,242 | → |
| Jinfeng [Jinfong] | Rural Township (Xiang) | 金峰鄉 | 3,323 | 3,262 | 3,401 | 3,519 | 2,280 | → |
| Lanyu [Orchid Island] | Rural Township (Xiang) | 蘭嶼鄉 | 2,876 | 3,011 | 3,235 | 4,691 | 2,454 | → |
| Lüdao [Lyudao, Green Island] | Rural Township (Xiang) | 綠島鄉 | 3,797 | 3,546 | 3,246 | 3,400 | 1,913 | → |
| Luye | Rural Township (Xiang) | 鹿野鄉 | 13,144 | 11,027 | 9,809 | 8,403 | 7,116 | → |
| Taidong [Taitung] | City (Shi) | 臺東市 | 110,721 | 108,086 | 110,894 | 108,310 | 106,840 | → |
| Taimali | Rural Township (Xiang) | 太麻里鄉 | 16,036 | 14,503 | 13,348 | 11,823 | 8,621 | → |
| Yanping | Rural Township (Xiang) | 延平鄉 | 4,478 | 4,017 | 3,729 | 3,560 | 1,750 | → |
| Taiwan | Republic | 臺灣 (中華民國) | 18,193,955 | 20,605,831 | 22,405,568 | 23,224,912 | 23,829,897 |
Source: Ministry of Interior, Republic of China (Taiwan); National Statistics, Republic of China (Taiwan).
Explanation: Census figures refer to the permanent population. They differ from the household population (23,570,130 in 2020) that is reported by Taiwanese population estimates.
Further information about the population structure:
| Gender (C 2020) | |
|---|---|
| Males | 95,153 |
| Females | 94,299 |
| Age Groups (C 2020) | |
|---|---|
| 0-14 years | 27,076 |
| 15-64 years | 126,880 |
| 65+ years | 35,496 |