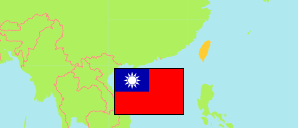
Miaoli
County (Xian) in Taiwan
Contents: Subdivision
The population development in Miaoli as well as related information and services (Wikipedia, Google, images).
| Name | Status | Native | Population Estimate 1981-12-31 | Population Estimate 1991-12-31 | Population Estimate 2001-12-31 | Population Estimate 2011-12-31 | Population Census 2020-11-01 | |
|---|---|---|---|---|---|---|---|---|
| Miaoli | County (Xian) | 苗栗縣 | 545,608 | 551,016 | 560,640 | 562,010 | 521,962 | |
| Dahu | Rural Township (Xiang) | 大湖鄉 | 21,865 | 19,187 | 17,120 | 15,899 | 11,053 | → |
| Gongguan | Rural Township (Xiang) | 公館鄉 | 33,074 | 33,182 | 34,875 | 34,847 | 27,644 | → |
| Houlong | Urban Township (Zhen) | 後龍鎮 | 46,486 | 44,023 | 42,284 | 38,986 | 33,874 | → |
| Miaoli | City (Shi) | 苗栗市 | 82,114 | 88,907 | 91,059 | 90,900 | 89,446 | → |
| Nanzhuang [Nanjhuang] | Rural Township (Xiang) | 南庄鄉 | 19,486 | 14,376 | 12,239 | 11,010 | 7,102 | → |
| Sanwan | Rural Township (Xiang) | 三灣鄉 | 10,447 | 8,211 | 7,783 | 7,210 | 4,836 | → |
| Sanyi | Rural Township (Xiang) | 三義鄉 | 17,175 | 17,707 | 18,071 | 17,487 | 14,314 | → |
| Shitan [Shihtan] | Rural Township (Xiang) | 獅潭鄉 | 8,596 | 6,500 | 5,469 | 4,821 | 2,657 | → |
| Tai'an [Taian] | Rural Township (Xiang) | 泰安鄉 | 6,274 | 5,630 | 5,600 | 5,947 | 2,808 | → |
| Tongluo | Rural Township (Xiang) | 銅鑼鄉 | 22,218 | 20,846 | 20,692 | 19,332 | 16,993 | → |
| Tongxiao [Tongsiao] | Urban Township (Zhen) | 通霄鎮 | 44,692 | 43,533 | 41,249 | 37,614 | 25,915 | → |
| Toufen | City (Shi) | 頭份市 | 68,195 | 79,629 | 89,384 | 98,377 | 106,523 | → |
| Touwu | Rural Township (Xiang) | 頭屋鄉 | 12,749 | 12,721 | 12,293 | 11,513 | 8,974 | → |
| Xihu [Sihu] | Rural Township (Xiang) | 西湖鄉 | 11,942 | 9,981 | 8,599 | 7,801 | 4,608 | → |
| Yuanli | Urban Township (Zhen) | 苑裡鎮 | 49,470 | 48,598 | 49,437 | 48,506 | 41,302 | → |
| Zaoqiao [Zaociao] | Rural Township (Xiang) | 造橋鄉 | 14,632 | 14,535 | 14,356 | 13,687 | 12,387 | → |
| Zhunan [Jhunan] | Urban Township (Zhen) | 竹南鎮 | 55,610 | 62,792 | 70,541 | 79,656 | 98,406 | → |
| Zhuolan [Jhuolan] | Urban Township (Zhen) | 卓蘭鎮 | 20,583 | 20,658 | 19,589 | 18,417 | 13,120 | → |
| Taiwan | Republic | 臺灣 (中華民國) | 18,193,955 | 20,605,831 | 22,405,568 | 23,224,912 | 23,829,897 |
Source: Ministry of Interior, Republic of China (Taiwan); National Statistics, Republic of China (Taiwan).
Explanation: Census figures refer to the permanent population. They differ from the household population (23,570,130 in 2020) that is reported by Taiwanese population estimates.
Further information about the population structure:
| Gender (C 2020) | |
|---|---|
| Males | 259,902 |
| Females | 262,060 |
| Age Groups (C 2020) | |
|---|---|
| 0-14 years | 70,791 |
| 15-64 years | 357,483 |
| 65+ years | 93,688 |