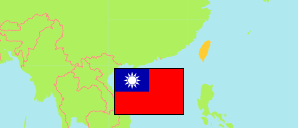
Xinbei Shi
Special Municipality in Taiwan
Contents: Subdivision
The population development in Xinbei Shi as well as related information and services (Wikipedia, Google, images).
| Name | Status | Native | Population Estimate 1981-12-31 | Population Estimate 1991-12-31 | Population Estimate 2001-12-31 | Population Estimate 2011-12-31 | Population Census 2020-11-01 | |
|---|---|---|---|---|---|---|---|---|
| Xinbei Shi [New Taipei City] | Special Municipality | 新北市 | 2,354,858 | 3,107,278 | 3,610,252 | 3,916,451 | 4,365,947 | |
| Bali | City District (Qu) | 八里區 | 14,860 | 17,648 | 29,624 | 35,423 | 42,582 | → |
| Banqiao [Banciao] | City District (Qu) | 板橋區 | 422,260 | 542,942 | 532,694 | 555,335 | 599,897 | → |
| Gongliao | City District (Qu) | 貢寮區 | 17,180 | 14,166 | 13,784 | 13,538 | 6,972 | → |
| Jinshan | City District (Qu) | 金山區 | 19,564 | 18,751 | 21,611 | 22,447 | 15,500 | → |
| Linkou | City District (Qu) | 林口區 | 23,986 | 34,125 | 52,651 | 86,628 | 136,414 | → |
| Luzhou [Lujhou] | City District (Qu) | 蘆洲區 | 48,568 | 112,560 | 169,316 | 198,373 | 223,113 | → |
| Pinglin | City District (Qu) | 坪林區 | 6,729 | 5,763 | 6,071 | 6,533 | 2,881 | → |
| Pingxi [Pingsi] | City District (Qu) | 平溪區 | 10,481 | 6,969 | 6,257 | 5,197 | 2,427 | → |
| Ruifang [Rueifang] | City District (Qu) | 瑞芳區 | 65,763 | 53,174 | 46,515 | 42,031 | 34,267 | → |
| Sanchong | City District (Qu) | 三重區 | 334,726 | 378,397 | 384,051 | 390,421 | 423,771 | → |
| Sanxia [Sansia] | City District (Qu) | 三峽區 | 52,435 | 61,627 | 84,189 | 105,629 | 119,568 | → |
| Sanzhi [Sanjhih] | City District (Qu) | 三芝區 | 16,600 | 17,234 | 23,027 | 23,319 | 23,844 | → |
| Shenkeng | City District (Qu) | 深坑區 | 10,620 | 13,409 | 20,264 | 23,531 | 33,318 | → |
| Shiding [Shihding] | City District (Qu) | 石碇區 | 8,944 | 7,065 | 7,612 | 7,887 | 4,887 | → |
| Shimen [Shihmen] | City District (Qu) | 石門區 | 10,480 | 9,452 | 11,158 | 12,841 | 5,352 | → |
| Shuangxi [Shuangsi] | City District (Qu) | 雙溪區 | 16,239 | 12,145 | 10,483 | 9,555 | 4,441 | → |
| Shulin | City District (Qu) | 樹林區 | 77,378 | 115,581 | 156,159 | 179,788 | 199,848 | → |
| Taishan | City District (Qu) | 泰山區 | 40,576 | 53,658 | 62,783 | 77,057 | 91,279 | → |
| Tamsui [Danshuei] | City District (Qu) | 淡水區 | 66,589 | 85,980 | 119,533 | 146,756 | 213,968 | → |
| Tucheng | City District (Qu) | 土城區 | 60,398 | 142,348 | 231,938 | 239,156 | 257,810 | → |
| Wanli | City District (Qu) | 萬里區 | 18,982 | 18,755 | 18,480 | 22,204 | 15,743 | → |
| Wugu | City District (Qu) | 五股區 | 35,644 | 48,796 | 70,649 | 80,518 | 105,182 | → |
| Wulai | City District (Qu) | 烏來區 | 3,151 | 3,247 | 4,531 | 5,927 | 3,364 | → |
| Xindian [Sindian] | City District (Qu) | 新店區 | 171,315 | 233,277 | 272,500 | 296,581 | 327,883 | → |
| Xinzhuang [Sinjhuang] | City District (Qu) | 新莊區 | 191,073 | 308,293 | 376,584 | 404,089 | 452,493 | → |
| Xizhi [Sijhih] | City District (Qu) | 汐止區 | 67,996 | 97,261 | 165,143 | 190,679 | 244,291 | → |
| Yingge | City District (Qu) | 鶯歌區 | 48,870 | 67,214 | 81,643 | 87,683 | 90,395 | → |
| Yonghe | City District (Qu) | 永和區 | 213,787 | 247,473 | 229,383 | 232,386 | 230,992 | → |
| Zhonghe [Jhonghe] | City District (Qu) | 中和區 | 279,664 | 379,968 | 401,619 | 414,939 | 453,465 | → |
| Taiwan | Republic | 臺灣 (中華民國) | 18,193,955 | 20,605,831 | 22,405,568 | 23,224,912 | 23,829,897 |
Source: Ministry of Interior, Republic of China (Taiwan); National Statistics, Republic of China (Taiwan).
Explanation: Census figures refer to the permanent population. They differ from the household population (23,570,130 in 2020) that is reported by Taiwanese population estimates.
Further information about the population structure:
| Gender (C 2020) | |
|---|---|
| Males | 2,131,784 |
| Females | 2,234,163 |
| Age Groups (C 2020) | |
|---|---|
| 0-14 years | 477,996 |
| 15-64 years | 3,296,614 |
| 65+ years | 591,337 |